Join the Conversation
- Find Answers
- :
- Splunk Administration
- :
- Getting Data In
- :
- Re: Input not working
- Subscribe to RSS Feed
- Mark Topic as New
- Mark Topic as Read
- Float this Topic for Current User
- Bookmark Topic
- Subscribe to Topic
- Mute Topic
- Printer Friendly Page
- Mark as New
- Bookmark Message
- Subscribe to Message
- Mute Message
- Subscribe to RSS Feed
- Permalink
- Report Inappropriate Content
Why is Input not working?
Hey Guys.
I have a input that is refusing to work.
The input that doesnt work is this fortigate one:
This one on the same syslog server works just fine:
Check the app on the syslog server and both inputs look like the above, so they have been pushed fine from the deployment server.
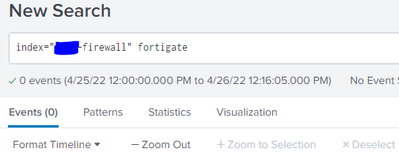
Nothing called fortigate is in splunk:
Recent Log files ARE populated and present on the syslogserver
If i search for the host from the fortigate input the following shows up, which to me looks like it should be forwarding logs?
- Mark as New
- Bookmark Message
- Subscribe to Message
- Mute Message
- Subscribe to RSS Feed
- Permalink
- Report Inappropriate Content
Hi @michaelnorup,
let me understand:
in /var/log/syslogd/10.200.252.231/ you have files with name *.log but you cannot read them. is it correct?
At first check if you're receiving Splunk internal logs from that host
index=_internal host=FW-XXX-ACTand if the hostname is correct.
Then, check if the user you're using to run Splunk on that system (I suppose a Universal Forwarder) has the grants to read those files and folders.
then check if the folder is correct: you can check this with a simple linux command
ls -la /var/log/syslogd/10.200.252.231/*.logthen I hint to not use "-" in names, it's better "_" becasuse (probably not in this case) it isn't read in a correct way.
Ciao.
Giuseppe
- Mark as New
- Bookmark Message
- Subscribe to Message
- Mute Message
- Subscribe to RSS Feed
- Permalink
- Report Inappropriate Content
Hey Giuseppe, thanks for stopping in
I am NOT recieving logs from the host, which is the entire problem right? The host however can be both the syslog server(which i am recieving plenty of logs from, just not this particular input), and the FW-XXX-FG in from the inputs.conf, which isnt working
Splunk forwarder is running as root, so should have access to read all
On the deploymentserver i can even see the folder and sourcetype under settings -> data inputs -> file and directories
- Mark as New
- Bookmark Message
- Subscribe to Message
- Mute Message
- Subscribe to RSS Feed
- Permalink
- Report Inappropriate Content
Hi @michaelnorup,
let me understand:
- you're receiving Splunk internal logs from that host,
- you're receiving other logs from that host,
- you're not receiving logs from the incriminated input,
- the running Splunk user is root so there isn't any grant problem.
when you say that the user is root, are you speking on the target server or on Deployment Server?
did you checked if the folder is correct (using the ls command) not on deployment server, but on the target server?
Ciao.
Giuseppe
- Mark as New
- Bookmark Message
- Subscribe to Message
- Mute Message
- Subscribe to RSS Feed
- Permalink
- Report Inappropriate Content
I am recieving internal logs from the syslog server.
I am recieving other logs( for example the cisco logs) from the syslog server
I am NOT recieving logs from the fortigate input from the syslog server (Deployed with the same app as the cisco input)
The user running splunk is root on the syslog server
I am ecen seeing both inputs correctly here on the deployment server
Am i reading these entires correct in that it IS in fact transmitting data from the fortigate input?
Can it be because the logs are so many and big that it simply hasnt caught up yet?
- Mark as New
- Bookmark Message
- Subscribe to Message
- Mute Message
- Subscribe to RSS Feed
- Permalink
- Report Inappropriate Content
It randomly works now. I guess it was just super slow at catching up
- Mark as New
- Bookmark Message
- Subscribe to Message
- Mute Message
- Subscribe to RSS Feed
- Permalink
- Report Inappropriate Content
Hi @michaelnorup,
probably you have to read too many files!
You cannot do many things in ths case, my hint is to analyze the delay between timestamp and indextime and consider it in alerts scheduling.
Ciao.
Giuseppe


