Join the Conversation
- Find Answers
- :
- Splunk Administration
- :
- Getting Data In
- :
- Why am I getting the error "disabled" when I launc...
- Subscribe to RSS Feed
- Mark Topic as New
- Mark Topic as Read
- Float this Topic for Current User
- Bookmark Topic
- Subscribe to Topic
- Mute Topic
- Printer Friendly Page
- Mark as New
- Bookmark Message
- Subscribe to Message
- Mute Message
- Subscribe to RSS Feed
- Permalink
- Report Inappropriate Content
Why am I getting the error "disabled" when I launch the deployment client page after a possibly successful deployment on Splunk 7.0?
Hi All,
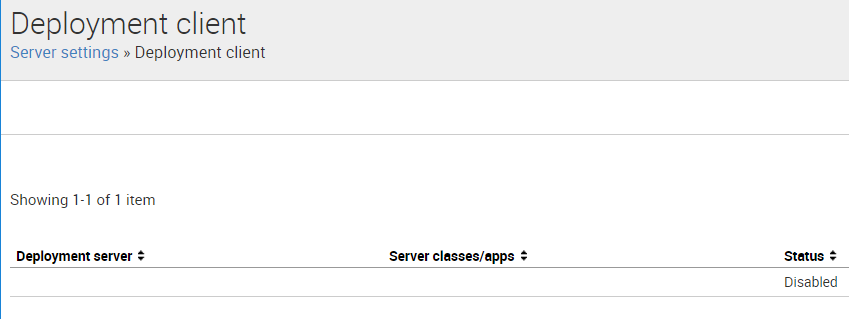
I just set up a deployment server, created server class and added a couple of deployment-apps and a forwarder to it. I believe it got deployed successfully as I can see the deployed configuration on the forwarder. However when I launch Deployment Client page it says DISABLED.
Also If I see the splunkd.log I can see the error - DC:DeploymentClient - target-broker clause is missing.
Would you be able to know where I'm wrong, Please?
- Mark as New
- Bookmark Message
- Subscribe to Message
- Mute Message
- Subscribe to RSS Feed
- Permalink
- Report Inappropriate Content
Are you looking at the "deployment client settings" page on the server which is also the "deployment server"?
You would not normally expect a DS to be a DC, so its quite normal to have the first screenshot you posted.
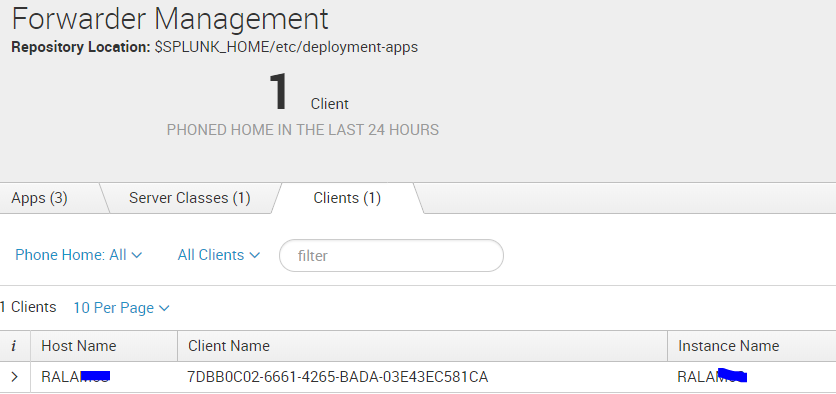
On the basis of your second screenshot, I would say everything looks good!
- Mark as New
- Bookmark Message
- Subscribe to Message
- Mute Message
- Subscribe to RSS Feed
- Permalink
- Report Inappropriate Content
thanks 🙂
- Mark as New
- Bookmark Message
- Subscribe to Message
- Mute Message
- Subscribe to RSS Feed
- Permalink
- Report Inappropriate Content
Cool. Glad it helped!
- Mark as New
- Bookmark Message
- Subscribe to Message
- Mute Message
- Subscribe to RSS Feed
- Permalink
- Report Inappropriate Content
One thing to check is splunkd.log on the deployment server ($SPLUNK_HOME/var/log/splunk/splunkd.log).
Search for the IP address of the forwarder. If all is well, you should see something like:
02-15-2018 08:52:10.584 -0800 INFO ClientSessionsManager:Listener_AppEvents - Received count=2 AppEvents from DC ip=xxx.xxx.xxx.14 name=01560258-7D14-4041-B938-47C85E919B75
If anything slows up with warnings or errors then there is a problem.
When you are looking at the Settings -> Forwarder Management > Clients page on the DS, you should see the forwarder host and under the column "Deployed Apps" the number of Deployment Apps you associated with the ServerClass you put the forwarder host into.
To quickly see if you are getting logs from that host, try this search on the search head:
| metadata type=hosts index=*
| search host=$HOSTNAME$
| stats count by host totalCount firstTime recentTime
| fieldformat Count=tostring(Count, "commas")
| convert timeformat="%m/%d/%Y %T" ctime(recentTime) ctime(firstTime)
| rename totalCount as Count recentTime as "Last Update" firstTime as "Earliest Update"
| fields - count
Where $HOSTNAME$ is the FQDN of the forwarder host.
- Mark as New
- Bookmark Message
- Subscribe to Message
- Mute Message
- Subscribe to RSS Feed
- Permalink
- Report Inappropriate Content
- Mark as New
- Bookmark Message
- Subscribe to Message
- Mute Message
- Subscribe to RSS Feed
- Permalink
- Report Inappropriate Content
Is that screenshot and log message on the forwarder or on the deployment server?
If you're on the deployment server, go to Settings -> Forwarder Management.


