- Splunk Answers
- :
- Splunk Administration
- :
- Getting Data In
- :
- Mark values in Diagram
- Subscribe to RSS Feed
- Mark Topic as New
- Mark Topic as Read
- Float this Topic for Current User
- Bookmark Topic
- Subscribe to Topic
- Mute Topic
- Printer Friendly Page
- Mark as New
- Bookmark Message
- Subscribe to Message
- Mute Message
- Subscribe to RSS Feed
- Permalink
- Report Inappropriate Content
Hi,
so I have a Bargraph with many values. The enduser who has to use that bargraph needs to see if the values are over or under certain values at some point. Thats why I want to draw a line at both the max allowed value and the min needed value. I attached a picture of how I want it to look. Is it possible to achieve something like this?
- Mark as New
- Bookmark Message
- Subscribe to Message
- Mute Message
- Subscribe to RSS Feed
- Permalink
- Report Inappropriate Content
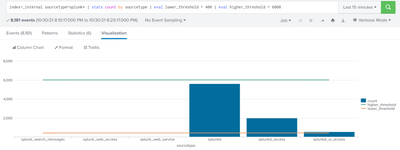
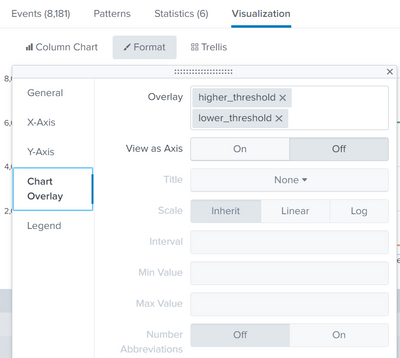
I believe you are trying to add threshold values to your Column chart. If so please try in adding the threshold limits via eval . And add them as chart overlays as shown below
index=_internal sourcetype=splunk* | stats count by sourcetype | eval lower_threshold = 400 | eval higher_threshold = 6000
- Mark as New
- Bookmark Message
- Subscribe to Message
- Mute Message
- Subscribe to RSS Feed
- Permalink
- Report Inappropriate Content
Hi again,
I now managed to show these thresholds in my chart. There is one Problem: I need the threshold on the X Axis not on the Y Axis(as I showed in the picture in my initial post above). Is there a way to do that?
- Mark as New
- Bookmark Message
- Subscribe to Message
- Mute Message
- Subscribe to RSS Feed
- Permalink
- Report Inappropriate Content
Thanks for the reply,
this seems to be exactly what I need, but I am not able to achieve the same result as you with my chart. I want to show just the value of one particular field and how often the different values exist. I do this via the pivot Tool. I cant find the Overlay option. DoI have to use the eval command?


