
Join the Conversation
- Find Answers
- :
- Splunk Administration
- :
- Getting Data In
- :
- How do I enable the HTTP Event Collector?
- Subscribe to RSS Feed
- Mark Topic as New
- Mark Topic as Read
- Float this Topic for Current User
- Bookmark Topic
- Subscribe to Topic
- Mute Topic
- Printer Friendly Page
- Mark as New
- Bookmark Message
- Subscribe to Message
- Mute Message
- Subscribe to RSS Feed
- Permalink
- Report Inappropriate Content
How do I enable the HTTP Event Collector?

The following HTTP Event Collector walkthrough
says -
-- To enable it, in Splunk Enterprise and self-service or trial Splunk Cloud, go to Settings > Data inputs > HTTP Event Collector.
However, what I see in Settings > Data inputs of our dev environment is -
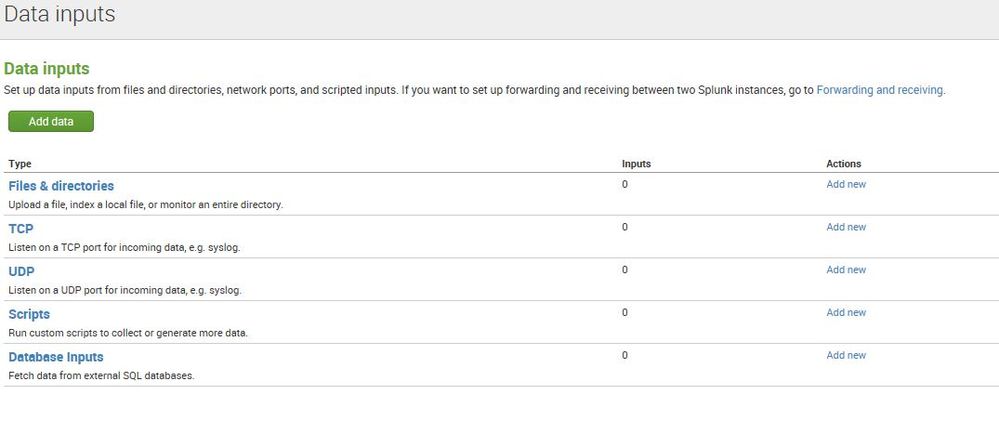
What can it be?
- Mark as New
- Bookmark Message
- Subscribe to Message
- Mute Message
- Subscribe to RSS Feed
- Permalink
- Report Inappropriate Content

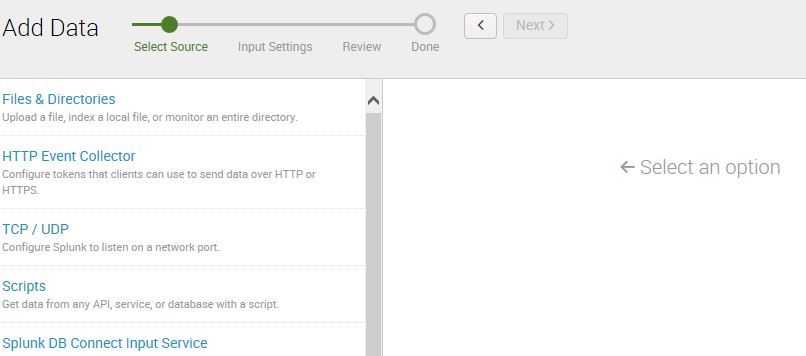
Run the Add Data wizard and select HTTP Event Collector. If it has not been initialized, it should automatically take you to the overview page where you can enter the global settings.
After that, you can use the Add Data wizard to add tokens.
I had this problem once, and after I entered the global settings, the HTTP Event Collector showed up on the Settings >> Data Inputs page.
If that doesn't work, it might be something quirky. If a Splunk restart doesn't fix it, I would enter a support ticket.
- Mark as New
- Bookmark Message
- Subscribe to Message
- Mute Message
- Subscribe to RSS Feed
- Permalink
- Report Inappropriate Content
Thank you @lguinn - no luck with the bounce, so, I'll open a support ticket.
Much appreciated.
- Mark as New
- Bookmark Message
- Subscribe to Message
- Mute Message
- Subscribe to RSS Feed
- Permalink
- Report Inappropriate Content

What version of Splunk are you using? (HEC available in 6.3+ versions).
- Mark as New
- Bookmark Message
- Subscribe to Message
- Mute Message
- Subscribe to RSS Feed
- Permalink
- Report Inappropriate Content
We are on 6.5.2.
- Mark as New
- Bookmark Message
- Subscribe to Message
- Mute Message
- Subscribe to RSS Feed
- Permalink
- Report Inappropriate Content




Join the Splunk Community Slack to learn, troubleshoot, and make connections with fellow Splunk practitioners in real time!
Join Splunk User Groups to connect and learn in-person by region or remotely by topic or industry.
Cisco Data Fabric from Architecture to Investigation, Better SOC Visibility, and More ...
The Trust Gap: Why a Data Foundation is Fundamental to an Agentic Enterprise
Data Management Digest – September 2026
