Join the Conversation
- Find Answers
- :
- Splunk Administration
- :
- Getting Data In
- :
- Re: CPU Utilization of Splunk Forwarder running on...
- Subscribe to RSS Feed
- Mark Topic as New
- Mark Topic as Read
- Float this Topic for Current User
- Bookmark Topic
- Subscribe to Topic
- Mute Topic
- Printer Friendly Page
- Mark as New
- Bookmark Message
- Subscribe to Message
- Mute Message
- Subscribe to RSS Feed
- Permalink
- Report Inappropriate Content
CPU Utilization of Splunk Forwarder running on Linux machine showing wrong values
Hi,
I have two servers running on Centos that have Universal Forwarder installed and I've enabled the following:
But using htop command on the servers, the CPU utilization is almost 100% but on splunk, it shows 20-30% at most.
Below is the query I used to find the CPU utilization for each available host:
host=* source="vmstat" | bucket span=300s _time | stats max(memUsedPct) as memUsedPct by _time host | timechart span=300s max(memUsedPct) as "Used Memory Percentage" by host limit=0
Please, is there a way to resonate with the htop results?
- Mark as New
- Bookmark Message
- Subscribe to Message
- Mute Message
- Subscribe to RSS Feed
- Permalink
- Report Inappropriate Content
You are asking about CPU utilization, but your search query is using memUsedPct (memory)....?
- Mark as New
- Bookmark Message
- Subscribe to Message
- Mute Message
- Subscribe to RSS Feed
- Permalink
- Report Inappropriate Content
this is the visualization of different hosts using the above query.
Hope this also gives you a better idea of what I'm achieving vs what I really wanna achieve.
- Mark as New
- Bookmark Message
- Subscribe to Message
- Mute Message
- Subscribe to RSS Feed
- Permalink
- Report Inappropriate Content
Hi,
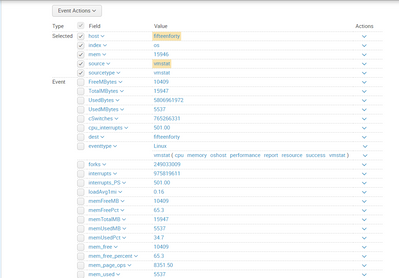
this is what I was getting in my search results.
please refer to the picture below:
Hope this gives you an idea about the memUsedPct (memory) I've indexed.


