- Find Answers
- :
- Splunk Administration
- :
- Deployment Architecture
- :
- Can you give me some guidance on interpreting the ...
- Subscribe to RSS Feed
- Mark Topic as New
- Mark Topic as Read
- Float this Topic for Current User
- Bookmark Topic
- Subscribe to Topic
- Mute Topic
- Printer Friendly Page
- Mark as New
- Bookmark Message
- Subscribe to Message
- Mute Message
- Subscribe to RSS Feed
- Permalink
- Report Inappropriate Content
Can you give me some guidance on interpreting the results of the pattern tab vs the cluster command output?
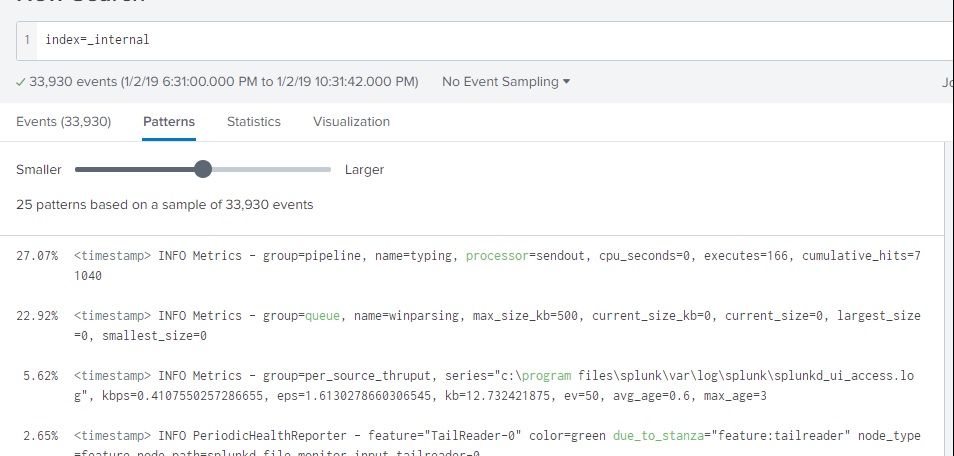
I need some guidance on interpreting the results of the pattern tab vs, the cluster command output. Basically, I do realize that the pattern tab output is an implementation of the cluster command. However, when I perform the below activities the results do not match and I am getting a bit lost here:
The above is just a rendition of index=_internal , run over the last 4 hours.
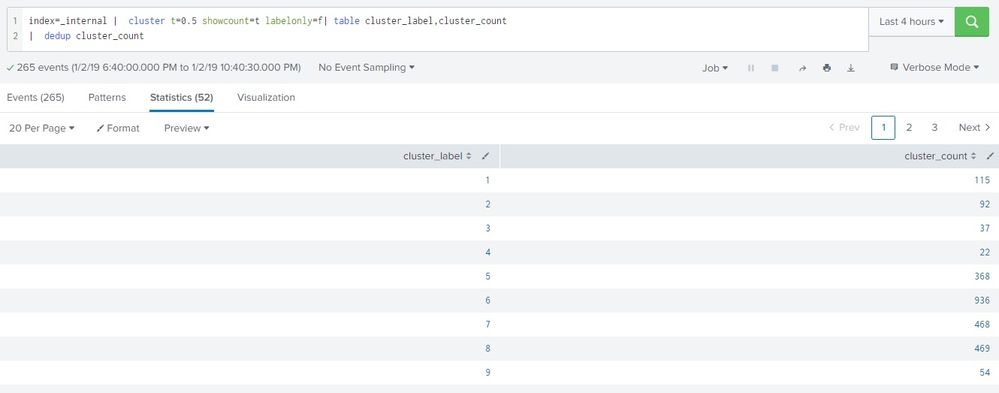
Now, when i run the cluster command with t-0.5. keeping the 'slider' in the pattern tab in the middle in the above snapshot. so as to coincide with t=0.5, in the cluster command , I receive the below output
My question is — The pattern tab says 25 patterns found, however, the cluster label is way above 25. Shouldn't they be the same? In other words, the # of patterns found should be equal to the unique clusters identified, given that the search is the same and run over the same time period with t=0.5/slider in middle of the pattern tab?
Where am I going wrong here?
- Mark as New
- Bookmark Message
- Subscribe to Message
- Mute Message
- Subscribe to RSS Feed
- Permalink
- Report Inappropriate Content
Read the document pages. There are many arguments to modify commands.
- Mark as New
- Bookmark Message
- Subscribe to Message
- Mute Message
- Subscribe to RSS Feed
- Permalink
- Report Inappropriate Content
@woodcock As i said, I read the documentation, I am sorry but I am not able to understand it and need some guidance. Based on the above description, do you have any explanation / suggestion to make?
- Mark as New
- Bookmark Message
- Subscribe to Message
- Mute Message
- Subscribe to RSS Feed
- Permalink
- Report Inappropriate Content
The patterns tab does sampling. If you set a fixed period of time, and do |head 1000 before the pattern tab or the cluster command, then you will often find the second most numerous cluster to be the largest pattern found, with the most numerous cluster being the "no pattern" group, assuming heterogenous event files.
- Mark as New
- Bookmark Message
- Subscribe to Message
- Mute Message
- Subscribe to RSS Feed
- Permalink
- Report Inappropriate Content
Hi @somesoni2 and @DalJeanis .
I ran the same exercise on the _internal index for a time range of 30/12-31/12 to keep the number of events constant , @somesoni2 but the discrepancy between the pattern tab and the cluster command still persists.
@DalJeanis - Not quite sure what you are trying to say. How would you apply a head 1000 before the pattern tab?Do you mean something like index=_internal |head 1000 AND THEN check the pattern tab outputs? Wouldn't doing this contradict the pattern tab instructions - which says something like , less than 5000 events may produce results?
I do agree that it does seem to say that a part /sample of the total events is used by the pattern tab, but this is not very clear. From my 1st screen shot you can see that the pattern tab says that all 33930 events have been used to determine the pattern.
Basically, splunk does say that the pattern tab is an implementation of the cluster command (which is the agglomerative clustering) and not the k means/ db scan used in the MLTK app. The results should match / at least be in some sort of sync. My example avobe gives 25 patterns and 60+ clusters for the same query (namely, a simple index=_internal search) , this is too wide to be justified in terms of sampling issues/total number of events mismatch.
I am sure I am missing something elementary here, what it is I don't know...
- Mark as New
- Bookmark Message
- Subscribe to Message
- Mute Message
- Subscribe to RSS Feed
- Permalink
- Report Inappropriate Content
Hi , Anyone@Splunk to answer this?
I really need some help here @niketnilay is it possible for you to look into this or involve some other splunk gurus?
- Mark as New
- Bookmark Message
- Subscribe to Message
- Mute Message
- Subscribe to RSS Feed
- Permalink
- Report Inappropriate Content
Check if the number of events for sampling is same for both (no of events scanned).


