
Join the Conversation
- Find Answers
- :
- Using Splunk
- :
- Dashboards & Visualizations
- :
- Re: remove the label in piechart
- Subscribe to RSS Feed
- Mark Topic as New
- Mark Topic as Read
- Float this Topic for Current User
- Bookmark Topic
- Subscribe to Topic
- Mute Topic
- Printer Friendly Page
- Mark as New
- Bookmark Message
- Subscribe to Message
- Mute Message
- Subscribe to RSS Feed
- Permalink
- Report Inappropriate Content

Hello Evryone
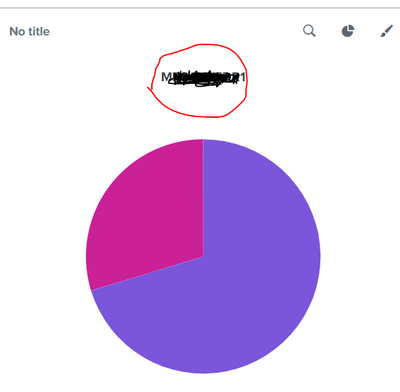
i have a panel with piechart i want to remove the highlighted part in the panel its coming with the chart its not the title
- Mark as New
- Bookmark Message
- Subscribe to Message
- Mute Message
- Subscribe to RSS Feed
- Permalink
- Report Inappropriate Content
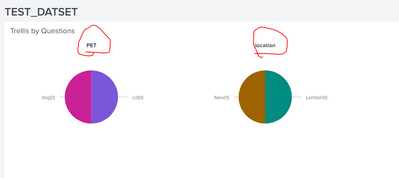
hi @vinod743374
yes its a field name in the query results
just an example below
| makeresults
| eval data=" Market=UK, Question=location, Answer=London;
Market=USA, Question=location, Answer=New York;
Market=UK, Question=PET, Answer=dog;
Market=USA, Question=PET, Answer=cat"
| makemv data delim=";"
| mvexpand data
| rename data as _raw
| KV
| stats count by Question, Answer
| eval Answer=Answer."(".count.")"
<dashboard>
<label>TEST_DATSET</label>
<row>
<panel>
<title>Trellis by Questions</title>
<chart>
<search>
<query>| makeresults
| eval data=" Market=UK, Question=location, Answer=London;
Market=USA, Question=location, Answer=New York;
Market=UK, Question=PET, Answer=dog;
Market=USA, Question=PET, Answer=cat"
| makemv data delim=";"
| mvexpand data
| rename data as _raw
| KV
| stats count by Question, Answer
| eval Answer=Answer."(".count.")"</query>
<earliest>-24h@h</earliest>
<latest>now</latest>
<sampleRatio>1</sampleRatio>
</search>
<option name="charting.chart">pie</option>
<option name="charting.chart.bubbleMaximumSize">50</option>
<option name="charting.chart.bubbleMinimumSize">10</option>
<option name="charting.chart.bubbleSizeBy">area</option>
<option name="refresh.display">progressbar</option>
<option name="charting.chart.showLabels">false</option>
<option name="trellis.enabled">1</option>
<option name="trellis.scales.shared">1</option>
<option name="trellis.size">medium</option>
</chart>
</panel>
</row>
</dashboard>
- Mark as New
- Bookmark Message
- Subscribe to Message
- Mute Message
- Subscribe to RSS Feed
- Permalink
- Report Inappropriate Content
- Mark as New
- Bookmark Message
- Subscribe to Message
- Mute Message
- Subscribe to RSS Feed
- Permalink
- Report Inappropriate Content

Does that name relate to the Field name of your query results?
We didn't find any labels after that line is been added in our dashboard,
I don't know why it is still showing in your case.
May I know the version of your Splunk.
- Mark as New
- Bookmark Message
- Subscribe to Message
- Mute Message
- Subscribe to RSS Feed
- Permalink
- Report Inappropriate Content
hi @vinod743374
yes its a field name in the query results
just an example below
| makeresults
| eval data=" Market=UK, Question=location, Answer=London;
Market=USA, Question=location, Answer=New York;
Market=UK, Question=PET, Answer=dog;
Market=USA, Question=PET, Answer=cat"
| makemv data delim=";"
| mvexpand data
| rename data as _raw
| KV
| stats count by Question, Answer
| eval Answer=Answer."(".count.")"
<dashboard>
<label>TEST_DATSET</label>
<row>
<panel>
<title>Trellis by Questions</title>
<chart>
<search>
<query>| makeresults
| eval data=" Market=UK, Question=location, Answer=London;
Market=USA, Question=location, Answer=New York;
Market=UK, Question=PET, Answer=dog;
Market=USA, Question=PET, Answer=cat"
| makemv data delim=";"
| mvexpand data
| rename data as _raw
| KV
| stats count by Question, Answer
| eval Answer=Answer."(".count.")"</query>
<earliest>-24h@h</earliest>
<latest>now</latest>
<sampleRatio>1</sampleRatio>
</search>
<option name="charting.chart">pie</option>
<option name="charting.chart.bubbleMaximumSize">50</option>
<option name="charting.chart.bubbleMinimumSize">10</option>
<option name="charting.chart.bubbleSizeBy">area</option>
<option name="refresh.display">progressbar</option>
<option name="charting.chart.showLabels">false</option>
<option name="trellis.enabled">1</option>
<option name="trellis.scales.shared">1</option>
<option name="trellis.size">medium</option>
</chart>
</panel>
</row>
</dashboard>
- Mark as New
- Bookmark Message
- Subscribe to Message
- Mute Message
- Subscribe to RSS Feed
- Permalink
- Report Inappropriate Content
Hi @vinod743374
css hack worked for my query any tips on how can learn these CSS style formattings
- Mark as New
- Bookmark Message
- Subscribe to Message
- Mute Message
- Subscribe to RSS Feed
- Permalink
- Report Inappropriate Content
Hi @venky1544
The only way is to do with CSS by assigning an id to the chart and apply some CSS.
the examples code is given below, you can try if u have no issues with applying CSS.
<dashboard version="1.1">
<label>TEST_DATSET</label>
<row>
<panel>
<title>Trellis by Questions</title>
<chart id="single1">
<search>
<query>| makeresults
| eval data=" Market=UK, Question=location, Answer=London;
Market=USA, Question=location, Answer=New York;
Market=UK, Question=PET, Answer=dog;
Market=USA, Question=PET, Answer=cat"
| makemv data delim=";"
| mvexpand data
| rename data as _raw
| KV
| stats count by Question, Answer
| eval Answer=Answer."(".count.")"</query>
<earliest>-24h@h</earliest>
<latest>now</latest>
<sampleRatio>1</sampleRatio>
</search>
<option name="charting.axisTitleX.visibility">collapsed</option>
<option name="charting.axisTitleY.visibility">collapsed</option>
<option name="charting.axisTitleY2.visibility">collapsed</option>
<option name="charting.chart">pie</option>
<option name="charting.chart.bubbleMaximumSize">50</option>
<option name="charting.chart.bubbleMinimumSize">10</option>
<option name="charting.chart.bubbleSizeBy">area</option>
<option name="charting.chart.showLabels">0</option>
<option name="charting.legend.placement">none</option>
<option name="refresh.display">progressbar</option>
<option name="trellis.enabled">1</option>
<option name="trellis.scales.shared">1</option>
<option name="trellis.size">medium</option>
<option name="trellis.splitBy">Question</option>
</chart>
</panel>
</row>
<row depends="$dontmatch$">
<panel>
<html>
<style>
div#single1 .facet-label {
display: none !important;
}
</style>
</html>
</panel>
</row>
</dashboard>
Thankyou.
- Mark as New
- Bookmark Message
- Subscribe to Message
- Mute Message
- Subscribe to RSS Feed
- Permalink
- Report Inappropriate Content
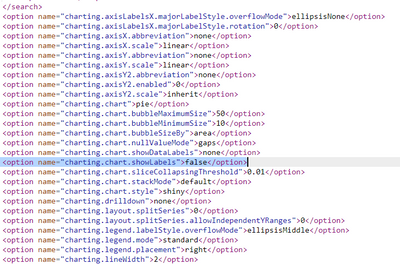
You Can try by removing the labels in the pie chart.
To achieve this by adding this below line in to the options of your pie chart in the source code.
<option name="charting.chart.showLabels">false</option>
Let me know if this works for you.
Thankyou!!


Join the Splunk Community Slack to learn, troubleshoot, and make connections with fellow Splunk practitioners in real time!
Join Splunk User Groups to connect and learn in-person by region or remotely by topic or industry.
SOC4Kafka - New Kafka Connector Powered by OpenTelemetry
Event Series: Level up your SOC: Advancing with Splunk Enterprise Security
Announcing Modern Navigation: A New Era of Splunk User Experience
