Join the Conversation
- Find Answers
- :
- Using Splunk
- :
- Dashboards & Visualizations
- :
- how to format single value chart based on multiple...
- Subscribe to RSS Feed
- Mark Topic as New
- Mark Topic as Read
- Float this Topic for Current User
- Bookmark Topic
- Subscribe to Topic
- Mute Topic
- Printer Friendly Page
- Mark as New
- Bookmark Message
- Subscribe to Message
- Mute Message
- Subscribe to RSS Feed
- Permalink
- Report Inappropriate Content
Hello,
I'd like to create a single value chart, based on below search, to display the number of invalid objects in a database. I would like to format in red (critical) when there is at least one invalid object from OWNER "SYS" or "SYSTEM", yellow (warning) if there is invalid object is coming from any other owner than "SYS" and "SYSTEM". Green if there isn't any invalid object in the database. It would be desirable if the count to display were the total of invalid objects in the database.
sourcetype=oracle:object STATUS!=VALID | stats count by OWNER
OWNER COUNT
SYS 1
MYCUST 2
Any help will be really appreciated.
- Mark as New
- Bookmark Message
- Subscribe to Message
- Mute Message
- Subscribe to RSS Feed
- Permalink
- Report Inappropriate Content
Since you do not just want Color ranges by count rather want Color Ranges based on fields and count, I would suggest going for Status Indicator Custom Visualization (https://splunkbase.splunk.com/app/3119/). Further your requirement is to have only one panel with Single value based on priority of results i.e. Red, Yellow Green (respectively), which makes the required code a bit tricky.
Following query will decide whether the Panel is Red, Yellow Or Green.
sourcetype=oracle:object STATUS!="VALID"
| stats count by OWNER
| appendcols [| makeresults
              | eval count=0
              | eval OWNER="Ok"
              | fields - _time]
| eval Icon=case(OWNER=="SYS" OR OWNER=="SYSTEM","times-circle",OWNER=="Ok","check-circle",true(),"exclaimation-circle")
| stats sum(count) as Count by Icon
| transpose header_field="Icon" column_name="Icon"
| eval filter=case('times-circle'>0,"times-circle",'exclamation-circle'>0,"exclaimaton-circle",true(),"check-circle")
You will then need to use Search Event Handler to pass on the required values Count, Icon and Color to Status Indicator Viz.
<done>
<!-- Check Red condition first if true then set Red Values -->
<condition match="$result.filter$=="times-circle"">
<set token="tokCount">$result.times-circle$</set>
<set token="tokIcon">times-circle</set>
<set token="tokColor">#ff0000</set>
</condition>
<!-- Check Yellow condition second if true then set Yellow Values -->
<condition match="$result.filter$=="exclamation-circle"">
<set token="tokCount">$result.exclamation-circle$</set>
<set token="tokIcon">exclamation-circle</set>
<set token="tokColor">#ffc200</set>
</condition>
<!-- Check Green condition in the end if true then set Green Values -->
<condition match="$result.filter$=="check-circle"">
<set token="tokCount">$result.check-circle$</set>
<set token="tokIcon">check-circle</set>
<set token="tokColor">#008000</set>
</condition>
</done>
When there is no results for INVALID status by any OWNER, appendcols will add Ok (Green) Status Row. times_circle icon and #ff0000 represent Red, exclaimation-circle icon and #ffc200 represent Yellow and check-circle icon and #008000 represent Green. Refer to documentation on Status Indicator for details - https://docs.splunk.com/Documentation/StatusIndicator/latest/StatusIndicatorViz/StatusIndicatorSearc...
Following is run anywhere example using Splunk's _internal index :
<!-- Query to find Status Indicator Count Icon and Color -->
<row>
<panel>
<table>
<search>
<query>index=_internal sourcetype=splunkd log_level!="INFO"
| stats count by log_level
| appendcols [| makeresults
| eval count=0
| eval log_level="Ok"
| fields - _time]
| eval Icon=case(log_level=="ERROR" OR log_level=="WARN","times-circle",log_level=="Ok","check-circle",true(),"exclaimation-circle")
| stats sum(count) as Count by Icon
| transpose header_field="Icon" column_name="Icon"
| eval filter=case('times-circle'>0,"times-circle",'exclamation-circle'>0,"exclaimaton-circle",true(),"check-circle")</query>
<earliest>@d</earliest>
<latest>now</latest>
<sampleRatio>1</sampleRatio>
<done>
<!-- Check Red condition first if true then set Red Values -->
<condition match="$result.filter$=="times-circle"">
<set token="tokCount">$result.times-circle$</set>
<set token="tokIcon">times-circle</set>
<set token="tokColor">#ff0000</set>
</condition>
<!-- Check Yellow condition second if true then set Yellow Values -->
<condition match="$result.filter$=="exclamation-circle"">
<set token="tokCount">$result.exclamation-circle$</set>
<set token="tokIcon">exclamation-circle</set>
<set token="tokColor">#ffc200</set>
</condition>
<!-- Check Green condition in the end if true then set Green Values -->
<condition match="$result.filter$=="check-circle"">
<set token="tokCount">$result.check-circle$</set>
<set token="tokIcon">check-circle</set>
<set token="tokColor">#008000</set>
</condition>
</done>
</search>
<option name="drilldown">none</option>
</table>
</panel>
</row>
<row>
<panel>
<viz type="status_indicator_app.status_indicator">
<search>
<query>| makeresults
| eval count=$tokCount$
| eval icon="$tokIcon$"
| eval color="$tokColor$"
| table count icon color</query>
<earliest>@d</earliest>
<latest>now</latest>
<sampleRatio>1</sampleRatio>
</search>
<option name="drilldown">none</option>
<option name="height">100</option>
<option name="status_indicator_app.status_indicator.colorBy">field_value</option>
<option name="status_indicator_app.status_indicator.fillTarget">background</option>
<option name="status_indicator_app.status_indicator.fixIcon">warning</option>
<option name="status_indicator_app.status_indicator.icon">field_value</option>
<option name="status_indicator_app.status_indicator.precision">0</option>
<option name="status_indicator_app.status_indicator.showOption">1</option>
<option name="status_indicator_app.status_indicator.staticColor">#555</option>
<option name="status_indicator_app.status_indicator.useColors">true</option>
<option name="status_indicator_app.status_indicator.useThousandSeparator">true</option>
</viz>
</panel>
</row>
| makeresults | eval message= "Happy Splunking!!!"
- Mark as New
- Bookmark Message
- Subscribe to Message
- Mute Message
- Subscribe to RSS Feed
- Permalink
- Report Inappropriate Content
Thanks niketnilay - looks like it's what we were looking for. I will be working on get it implemented.
- Mark as New
- Bookmark Message
- Subscribe to Message
- Mute Message
- Subscribe to RSS Feed
- Permalink
- Report Inappropriate Content
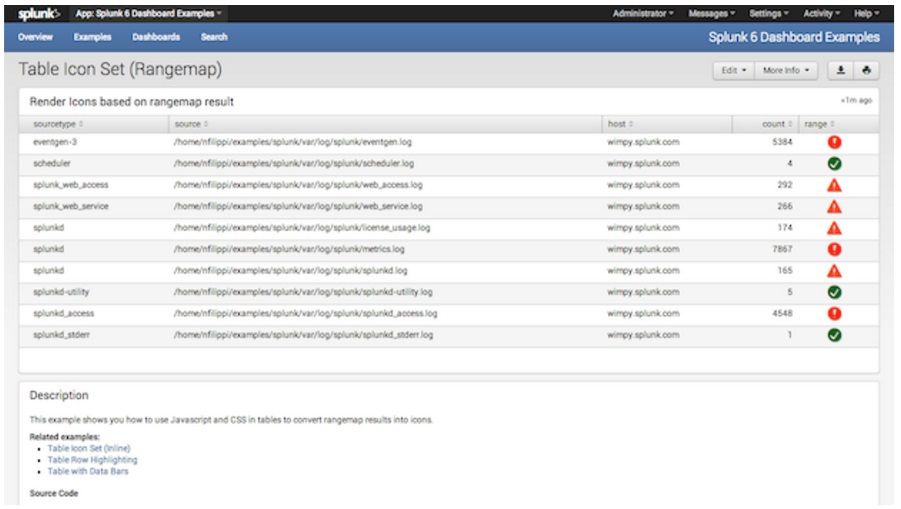
if you need to use the above query, you could try "Splunk 6.x Dashboard Examples" app, which got a "rangemap" that will be suitable for your task.
https://splunkbase.splunk.com/app/1603/
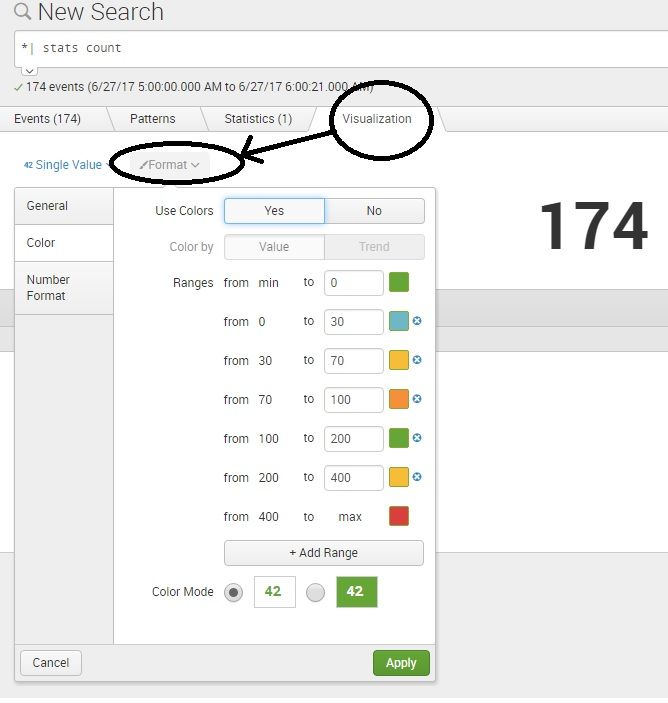
for single value, the search query should generate only one numerical output.
so you can use -
sourcetype=oracle:object STATUS!=VALID OWNER=SYS | stats count
then using the format options, you can apply color settings.
everytime, manually applying color, maybe looks like a strange task. but this will be useful for real time count monitors, or you can save it as a dashboard and when you open the dashboard, the query will be run and color will be automatically selected.
Sekar
PS - If this or any post helped you in any way, pls consider upvoting, thanks for reading !


