
Join the Conversation
- Find Answers
- :
- Using Splunk
- :
- Dashboards & Visualizations
- :
- Re: how draw multiple lines on one area
- Subscribe to RSS Feed
- Mark Topic as New
- Mark Topic as Read
- Float this Topic for Current User
- Bookmark Topic
- Subscribe to Topic
- Mute Topic
- Printer Friendly Page
- Mark as New
- Bookmark Message
- Subscribe to Message
- Mute Message
- Subscribe to RSS Feed
- Permalink
- Report Inappropriate Content

By my ex-post, https://community.splunk.com/t5/Dashboards-Visualizations/how-draw-a-line-connects-from-plot-to-plot... this solution solved my ex-issue and now I would like to expand this usage to draw multiple lines on one graph area.
To do so, what I am doing now is try to analyze sports data, let's say "Tennis", and that original data has a serve info, a point where a player hit a serve and a land point where a ball landed. When I have this kind data, I could draw each points by using scatter charts, then I would like to draw a line from a serve hit point to a land point for each serve. I created a dummy date like below and tried to use the solution however it does not work well.
Not work point:
1. Duplicated data, such as a serve hit point, does not appear
2. Cannot draw lines into a one graph area(map?)
How I can create a graph like below on a Dashboard from below sample data? Please advise.
| makeresults
| eval _raw="serve,xpoint,ypoint
first-serve,4.5,-0.3
first-serve_land,3.8,15.6
second-serve,4.5,-0.3
second-serve_land,3.6,16.0
third-serve,4.6,-0.2
third-serve_land,3.8,16.3
fourth-serve,4.7,-0.4
fourth-serve_land,3.9,16.5
fifth-serve,4.6,-0.5
fifth-serve_land,4.0,16.9"
| multikv forceheader=1
| table serve,xpoint,ypoint

- Mark as New
- Bookmark Message
- Subscribe to Message
- Mute Message
- Subscribe to RSS Feed
- Permalink
- Report Inappropriate Content


Treat each serve as a series of data. For first-serve, you have points (4.5,-0.3) and (3.5,15.6), for second-serve you have points (4.5,-0.3) and (3.6,16.0), and so on.
As with the answer to your earlier question, use xyseries to chart the y-axis value over the x-axis value by series:
| makeresults
| eval _raw="serve,xpoint,ypoint
first-serve,4.5,-0.3
first-serve,3.8,15.6
second-serve,4.5,-0.3
second-serve,3.6,16.0
third-serve,4.6,-0.2
third-serve,3.8,16.3
fourth-serve,4.7,-0.4
fourth-serve,3.9,16.5
fifth-serve,4.6,-0.5
fifth-serve,4.0,16.9"
| multikv forceheader=1
| xyseries xpoint serve ypoint
| xpoint | fifth-serve | first-serve | fourth-serve | second-serve | third-serve |
| 3.6 | 16 | ||||
| 3.8 | 15.6 | 16.3 | |||
| 3.9 | 16.5 | ||||
| 4 | 16.9 | ||||
| 4.5 | -0.3 | -0.3 | |||
| 4.6 | -0.5 | -0.2 | |||
| 4.7 | -0.4 |
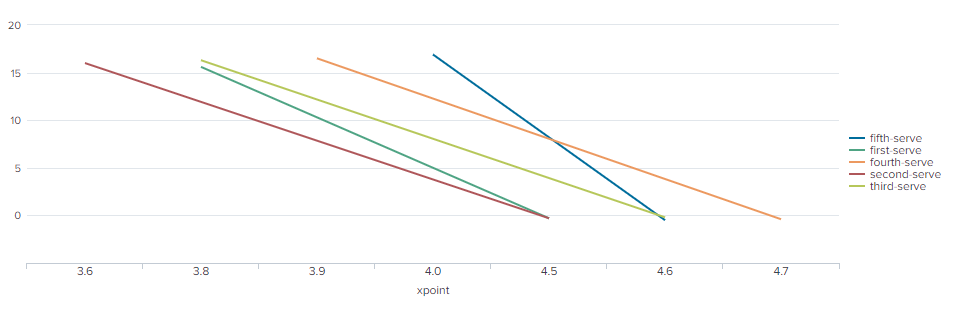
Under General chart options for the line chart, select the "Connect" option for null values to draw lines between the points.
See the Splunk Dashboards app for fun ways to position and size charts over background images.
- Mark as New
- Bookmark Message
- Subscribe to Message
- Mute Message
- Subscribe to RSS Feed
- Permalink
- Report Inappropriate Content
Treat each serve as a series of data. For first-serve, you have points (4.5,-0.3) and (3.5,15.6), for second-serve you have points (4.5,-0.3) and (3.6,16.0), and so on.
As with the answer to your earlier question, use xyseries to chart the y-axis value over the x-axis value by series:
| makeresults
| eval _raw="serve,xpoint,ypoint
first-serve,4.5,-0.3
first-serve,3.8,15.6
second-serve,4.5,-0.3
second-serve,3.6,16.0
third-serve,4.6,-0.2
third-serve,3.8,16.3
fourth-serve,4.7,-0.4
fourth-serve,3.9,16.5
fifth-serve,4.6,-0.5
fifth-serve,4.0,16.9"
| multikv forceheader=1
| xyseries xpoint serve ypoint
| xpoint | fifth-serve | first-serve | fourth-serve | second-serve | third-serve |
| 3.6 | 16 | ||||
| 3.8 | 15.6 | 16.3 | |||
| 3.9 | 16.5 | ||||
| 4 | 16.9 | ||||
| 4.5 | -0.3 | -0.3 | |||
| 4.6 | -0.5 | -0.2 | |||
| 4.7 | -0.4 |
Under General chart options for the line chart, select the "Connect" option for null values to draw lines between the points.
See the Splunk Dashboards app for fun ways to position and size charts over background images.
- Mark as New
- Bookmark Message
- Subscribe to Message
- Mute Message
- Subscribe to RSS Feed
- Permalink
- Report Inappropriate Content
Thank you so much. This solution works and I need figure out how to modify better visualization positioning and sizing as you mention on a dashboard to make it fit on a tennis court image.


Join the Splunk Community Slack to learn, troubleshoot, and make connections with fellow Splunk practitioners in real time!
Join Splunk User Groups to connect and learn in-person by region or remotely by topic or industry.
A Four-Part Event Series: Full Stack Observability For the AI Era
SOC4Kafka - New Kafka Connector Powered by OpenTelemetry
Event Series: Level up your SOC: Advancing with Splunk Enterprise Security
