
Turn on suggestions
Auto-suggest helps you quickly narrow down your search results by suggesting possible matches as you type.
Dashboards & Visualizations
×
Join the Conversation
Without signing in, you're just watching from the sidelines. Sign in or Register to connect, share, and be part of the Splunk Community.
- Find Answers
- :
- Using Splunk
- :
- Dashboards & Visualizations
- :
- generating a graphic in dashboard xml code
Options
- Subscribe to RSS Feed
- Mark Topic as New
- Mark Topic as Read
- Float this Topic for Current User
- Bookmark Topic
- Subscribe to Topic
- Mute Topic
- Printer Friendly Page
- Mark as New
- Bookmark Message
- Subscribe to Message
- Mute Message
- Subscribe to RSS Feed
- Permalink
- Report Inappropriate Content
generating a graphic in dashboard xml code

riley_lewis
Loves-to-Learn Lots
04-23-2024
10:06 AM
Hi,
I am trying to do a chart overlay using a normal distribution graphic based upon the mean and standard deviation acquired from the fieldsummary command. I can generate the values in perl (below) for a bell curve. Can you tell me how to do this in the Splunk Dashboard xml? Thanks.
#!/usr/bin/perl

# min, max, count, mean, stdev all come from the fieldsummary command.

$min = 0.442;
$max = 0.507;
$mean = 0.4835625;
$stdev = 0.014440074377630105;
$count = 128;
$pi = 3.141592653589793238462;

# The numbers above do not indicate a Gaussian distribution.
# Create an artificial normal distribution (for the plot overlay)
# based on 6-sigma.

$min = sprintf("%.3f", $mean - 3.0*$stdev);       # use sprintf as a rounding function
$max = sprintf("%.3f", $mean + 3.0*$stdev);

$interval = ($max - $min)/($count - 1);
$x = $min;
for ($i=0; $i<$count; $i++)
  {
   $y = (1.0/($stdev*sqrt(2.0*$pi))) * exp(-0.5*((($x-$mean)/$stdev)**2));
   $myFIELD[$i] = sprintf(%.3f",$y);
   printf("myFIELD[$i]\n");
   $x = $x + $interval;
  }

exit;- Mark as New
- Bookmark Message
- Subscribe to Message
- Mute Message
- Subscribe to RSS Feed
- Permalink
- Report Inappropriate Content

bowesmana

SplunkTrust
04-23-2024
07:11 PM
Quite literally
| makeresults
| fields - _time
| eval min = 0.442
| eval max = 0.507
| eval mean = 0.4835625
| eval stdev = 0.014440074377630105
| eval count = 128
| eval pi = 3.141592653589793238462
| eval min = printf("%.3f", mean - 3.0 *stdev)```;       # use sprintf as a rounding function```
| eval max = printf("%.3f", mean + 3.0 * stdev)
| eval x=min
| eval interval = (max - min)/(count - 1)
| eval c=mvrange(0, count, 1)
| foreach c mode=multivalue [ | eval y= (1.0/(stdev * sqrt(2.0 * pi))) * exp(-0.5*(pow(((x - mean) / stdev), 2))), myFIELD=mvappend(myFIELD, printf("%.3d", y)), x = x + interval ]
| fields - c
- Mark as New
- Bookmark Message
- Subscribe to Message
- Mute Message
- Subscribe to RSS Feed
- Permalink
- Report Inappropriate Content
bowesmana
SplunkTrust
04-23-2024
07:25 PM
And if you then want to make that a bar chart, replace the fields - c at the end with
| fields myFIELD
| mvexpand myFIELD
| eval count=tonumber(myFIELD)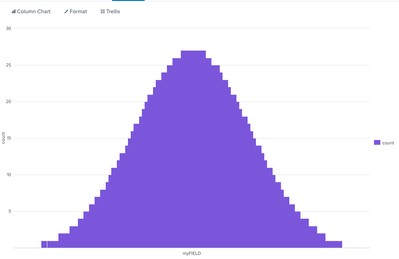


Got questions? Get answers!
Join the Splunk Community Slack to learn, troubleshoot, and make connections with fellow Splunk practitioners in real time!
Meet up IRL or virtually!
Join Splunk User Groups to connect and learn in-person by region or remotely by topic or industry.
Get Updates on the Splunk Community!
Forwarder Topology Guidance: Intermediate HF vs Intermediate UF
Why Universal Forwarders Should Not Be Used as Intermediate Forwarders
A practical Splunk forwarding topology ...
At .conf26, Don’t Just See What’s Next. Help Shape It at Innovation Labs.
Long before a new capability reaches the keynote stage, it begins as an idea waiting to be tested. At ...
Data Management Digest – August 2026
Data Management Digest
Welcome to the August 2026 edition of Data Management Digest!
August was a big month ...
