Are you a member of the Splunk Community?
- Find Answers
- :
- Using Splunk
- :
- Dashboards & Visualizations
- :
- Unable to color text in single value field
- Subscribe to RSS Feed
- Mark Topic as New
- Mark Topic as Read
- Float this Topic for Current User
- Bookmark Topic
- Subscribe to Topic
- Mute Topic
- Printer Friendly Page
- Mark as New
- Bookmark Message
- Subscribe to Message
- Mute Message
- Subscribe to RSS Feed
- Permalink
- Report Inappropriate Content
Dear Splunk Community,
I have the following code:
<dashboard>
<label></label>
<row>
<panel>
<single>
<search>
<query>host="DESKTOP-L4ID3T2"
source="BatchProcessor*"
inventoryimport*
"ExitCode: 0"
| stats count
| eval msg=case(count == 0, "Scan niet succesvol!", count > 0, "Scan succesvol!")
| eval range=case(count == 0, "severe", count > 0, "low")
| table msg</query>
<earliest>-24h@h</earliest>
<latest>now</latest>
</search>
<option name="field">range</option>
<option name="drilldown">none</option>
<option name="refresh.display">progressbar</option>
</single>
</panel>
</row>
</dashboard>
If count returns 0 events, I expect the color of the single value field to be red (severe), otherwise it should be green (low). But using the above code, there is no color at all (besides the default color black and white).
Why is the above not working?
Thanks in advance.
- Mark as New
- Bookmark Message
- Subscribe to Message
- Mute Message
- Subscribe to RSS Feed
- Permalink
- Report Inappropriate Content
Go back to
| table msg rangeand remove this line
<option name="field">range</option>
- Mark as New
- Bookmark Message
- Subscribe to Message
- Mute Message
- Subscribe to RSS Feed
- Permalink
- Report Inappropriate Content
Try adding these options
<option name="colorBy">value</option>
<option name="rangeColors">["0x53a051","0xdc4e41"]</option>- Mark as New
- Bookmark Message
- Subscribe to Message
- Mute Message
- Subscribe to RSS Feed
- Permalink
- Report Inappropriate Content
Unfortunately it doesn't apply:
Code:
<dashboard>
<label></label>
<row>
<panel>
<single>
<search>
<query>host="DESKTOP-L4ID3T2"
source="BatchProcessor*"
inventoryimport*
"ExitCode: 0"
| stats count
| eval msg=case(count == 0, "Scan niet succesvol!", count > 0, "Scan succesvol!")
| eval range=case(count == 0, "severe", count > 0, "low")
| table msg</query>
<earliest>0</earliest>
<latest></latest>
</search>
<option name="field">range</option>
<option name="drilldown">none</option>
<option name="refresh.display">progressbar</option>
<option name="colorBy">value</option>
<option name="rangeColors">["0x53a051","0xdc4e41"]</option>
</single>
</panel>
</row>
<row>
<panel>
<single>
<search>
<query>host="DESKTOP-L4ID3T2"
source="BatchProcessor*"
inventoryimport*
"ExitCode: 0"
| stats count
| eval msg=case(count == 0, "Scan niet succesvol!", count > 0, "Scan succesvol!")
| eval range=case(count == 0, "severe", count > 0, "low")
| table msg</query>
<earliest>@d</earliest>
<latest>now</latest>
</search>
<option name="field">range</option>
<option name="drilldown">none</option>
<option name="refresh.display">progressbar</option>
<option name="colorBy">value</option>
<option name="rangeColors">["0x53a051","0xdc4e41"]</option>
</single>
</panel>
</row>
</dashboard>
- Mark as New
- Bookmark Message
- Subscribe to Message
- Mute Message
- Subscribe to RSS Feed
- Permalink
- Report Inappropriate Content
@ITWhisperer Hello Sensei, could you take another look at this 🙏?
- Mark as New
- Bookmark Message
- Subscribe to Message
- Mute Message
- Subscribe to RSS Feed
- Permalink
- Report Inappropriate Content
You need to include range as an output field (single will only display values from the first field but can use other fields for the colouring)
| table msg range- Mark as New
- Bookmark Message
- Subscribe to Message
- Mute Message
- Subscribe to RSS Feed
- Permalink
- Report Inappropriate Content
This is the result
- Mark as New
- Bookmark Message
- Subscribe to Message
- Mute Message
- Subscribe to RSS Feed
- Permalink
- Report Inappropriate Content
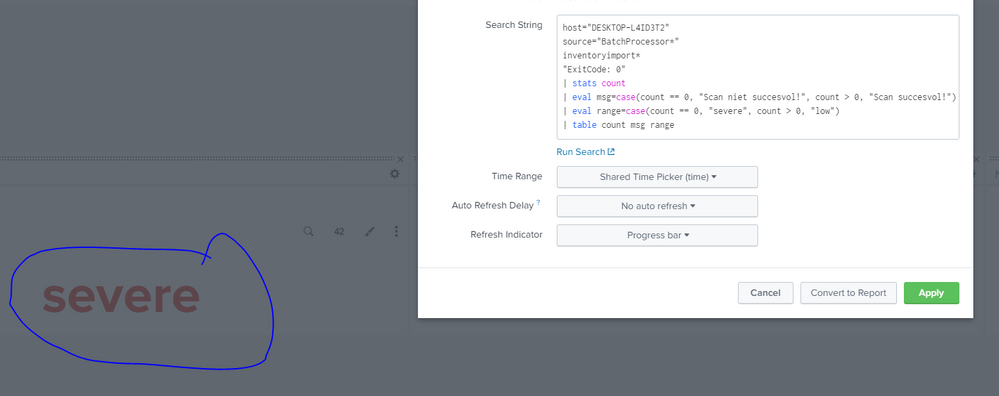
I have applied range ( | table msg range) and even though the coloring works, the text is either severe (red) or low (green) where I would expect Scan not succesful (red) / Scan succesful (green). Any thoughts?
- Mark as New
- Bookmark Message
- Subscribe to Message
- Mute Message
- Subscribe to RSS Feed
- Permalink
- Report Inappropriate Content
Go back to
| table msg rangeand remove this line
<option name="field">range</option>
- Mark as New
- Bookmark Message
- Subscribe to Message
- Mute Message
- Subscribe to RSS Feed
- Permalink
- Report Inappropriate Content
Works! Thanks
- Mark as New
- Bookmark Message
- Subscribe to Message
- Mute Message
- Subscribe to RSS Feed
- Permalink
- Report Inappropriate Content
Single is using the first two fields so put count as the first
| table count msg range

