
Join the Conversation
- Find Answers
- :
- Using Splunk
- :
- Dashboards & Visualizations
- :
- Re: Single Report dashboard with multiple panels b...
- Subscribe to RSS Feed
- Mark Topic as New
- Mark Topic as Read
- Float this Topic for Current User
- Bookmark Topic
- Subscribe to Topic
- Mute Topic
- Printer Friendly Page
- Mark as New
- Bookmark Message
- Subscribe to Message
- Mute Message
- Subscribe to RSS Feed
- Permalink
- Report Inappropriate Content

I have created a dashboard with multiple panels with each panel based on a dedicated report. Here's an example. This works great but there must be a better way to do this instead of having 4 reports per dashboard when the only difference between the search is the time.
<dashboard>
  <label>Packets</label>
  <row>
    <panel>
      <title>Daily</title>
      <chart>
        <search ref="Packets Daily"></search>
        <option name="charting.drilldown">none</option>
      </chart>
    </panel>
  </row>
  <row>
    <panel>
      <title>Weekly</title>
      <chart>
        <search ref="Packets Weekly"></search>
        <option name="charting.drilldown">none</option>
      </chart>
    </panel>
  </row>
  <row>
    <panel>
      <title>Monthly</title>
      <chart>
        <search ref="Packets Monthly"></search>
        <option name="charting.drilldown">none</option>
      </chart>
    </panel>
  </row>
  <row>
    <panel>
      <title>Yearly</title>
      <chart>
        <search ref="Packets Yearly"></search>
        <option name="charting.drilldown">none</option>
      </chart>
    </panel>
  </row>
</dashboard>
What I would prefer to do is have one single report with each panel having the correct time frame. I do not want a time picker displayed on the dashboard.
I tried using earliest and latest syntax in each search section of the xml but the time is inherited from the
report.
Thanks in advance.
- Mark as New
- Bookmark Message
- Subscribe to Message
- Mute Message
- Subscribe to RSS Feed
- Permalink
- Report Inappropriate Content


You can have a single daily packet report which is given a search id and then in the weekly/monthly/yearly you can just reference the daily report and post process calculate the appropriate periods with whatever aggregation you need.
Let's assume your daily packets search looks like this
my_packet_search
| timechart span=1d count
then your dashboard would look like this
<dashboard>
  <label>Packets</label>
  <row>
    <panel>
      <title>Daily</title>
      <chart>
        <search ref="Packets Daily" id="daily_report"></search>
        <option name="charting.drilldown">none</option>
      </chart>
    </panel>
  </row>
  <row>
    <panel>
      <title>Weekly</title>
      <chart>
        <search id="weekly_report" base="daily_report">
          <query>
| timechart span=1w sum(*) as *
          </query>
        </search>
        <option name="charting.drilldown">none</option>
      </chart>
    </panel>
  </row>
  <row>
    <panel>
      <title>Monthly</title>
      <chart>
        <search id="monthly_report" base="weekly_report">
          <query>
| timechart span=1mon sum(*) as *
          </query>
        </search>
        <option name="charting.drilldown">none</option>
      </chart>
    </panel>
  </row>
  <row>
    <panel>
      <title>Yearly</title>
      <chart>
        <search base="monthly_report">
          <query>
| timechart span=1y sum(*) as *
          </query>
        </search>
        <option name="charting.drilldown">none</option>
      </chart>
    </panel>
  </row>
</dashboard>
The base search could be daily_report in all cases, but by simply calling each subsequent search its own id, you can use the slightly smaller dataset for the larger granularity calculation.
- Mark as New
- Bookmark Message
- Subscribe to Message
- Mute Message
- Subscribe to RSS Feed
- Permalink
- Report Inappropriate Content
You can have a single daily packet report which is given a search id and then in the weekly/monthly/yearly you can just reference the daily report and post process calculate the appropriate periods with whatever aggregation you need.
Let's assume your daily packets search looks like this
my_packet_search
| timechart span=1d count
then your dashboard would look like this
<dashboard>
  <label>Packets</label>
  <row>
    <panel>
      <title>Daily</title>
      <chart>
        <search ref="Packets Daily" id="daily_report"></search>
        <option name="charting.drilldown">none</option>
      </chart>
    </panel>
  </row>
  <row>
    <panel>
      <title>Weekly</title>
      <chart>
        <search id="weekly_report" base="daily_report">
          <query>
| timechart span=1w sum(*) as *
          </query>
        </search>
        <option name="charting.drilldown">none</option>
      </chart>
    </panel>
  </row>
  <row>
    <panel>
      <title>Monthly</title>
      <chart>
        <search id="monthly_report" base="weekly_report">
          <query>
| timechart span=1mon sum(*) as *
          </query>
        </search>
        <option name="charting.drilldown">none</option>
      </chart>
    </panel>
  </row>
  <row>
    <panel>
      <title>Yearly</title>
      <chart>
        <search base="monthly_report">
          <query>
| timechart span=1y sum(*) as *
          </query>
        </search>
        <option name="charting.drilldown">none</option>
      </chart>
    </panel>
  </row>
</dashboard>
The base search could be daily_report in all cases, but by simply calling each subsequent search its own id, you can use the slightly smaller dataset for the larger granularity calculation.
- Mark as New
- Bookmark Message
- Subscribe to Message
- Mute Message
- Subscribe to RSS Feed
- Permalink
- Report Inappropriate Content

Agree, this is a far better solution, as 1 base search can give 4 panel results, unlike my suggested method which is less efficient with 4 base searches.
- Mark as New
- Bookmark Message
- Subscribe to Message
- Mute Message
- Subscribe to RSS Feed
- Permalink
- Report Inappropriate Content
I discovered the problem. The search behind the report was to restrictive on the time so I could not expand the time in the dashboard panels. Once I fixed that I was able to use the correct time modifiers in each panel.
@bowesmana, I like the search id functionality and knowing I can tack span on to the query generated from the report is helpful.
- Mark as New
- Bookmark Message
- Subscribe to Message
- Mute Message
- Subscribe to RSS Feed
- Permalink
- Report Inappropriate Content
Hi @adsquaired
Yes, you can use the savedsearch command and pass it the earliest and latest times as replaced field values. Here's the doc ref.
https://docs.splunk.com/Documentation/SplunkCloud/latest/SearchReference/Savedsearch
As an example
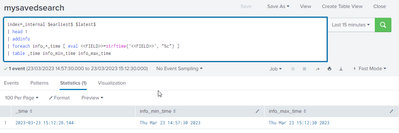
1. Create a saved search (report)
index=_internal $earliest$ $latest$
| head 1
| addinfo
| foreach info_*_time [ eval <<FIELD>>=strftime('<<FIELD>>', "%c") ]
| table _time info_min_time info_max_time
2. Now run the report using the savedsearch command, passing in the earliest and latest variables as time modifiers (you can name these variables to whatever you like)
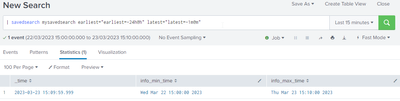
Note, the dashboard XML for the search would need to be something like this
<search>
  <query>| savedsearch mysavedsearch earliest="earliest=-24h@h" latest="latest=-1m@m"</query>
</search>
Hope this helps.
Please mark as solution provided if this works for you.


Join the Splunk Community Slack to learn, troubleshoot, and make connections with fellow Splunk practitioners in real time!
Join Splunk User Groups to connect and learn in-person by region or remotely by topic or industry.
Data Management Digest – September 2026
Federated Search for CloudWatch Unified Data Store Is Generally Available
Announcing Modern Navigation: A New Era of Splunk User Experience
