
Join the Conversation
- Find Answers
- :
- Using Splunk
- :
- Dashboards & Visualizations
- :
- Re: Rotate the data on bar chart value
- Subscribe to RSS Feed
- Mark Topic as New
- Mark Topic as Read
- Float this Topic for Current User
- Bookmark Topic
- Subscribe to Topic
- Mute Topic
- Printer Friendly Page
- Mark as New
- Bookmark Message
- Subscribe to Message
- Mute Message
- Subscribe to RSS Feed
- Permalink
- Report Inappropriate Content

Hi Support
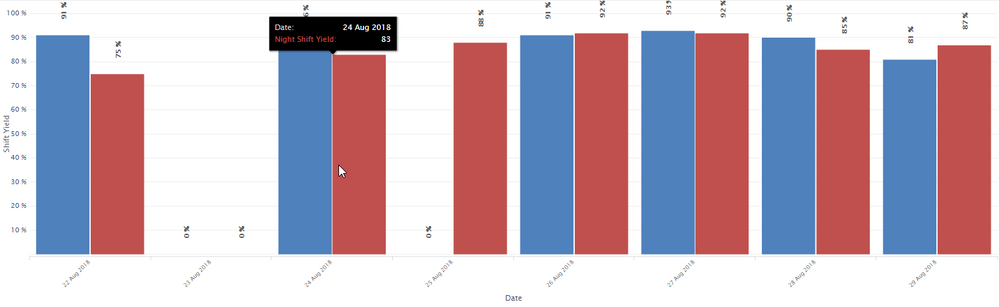
I have a bar chart. I can do the show value (Select Format > General > Show Data Values > On), but the value are shown as horizontal.
Is there a ways to show the data is vertical in the bar chart?
Regards
- Mark as New
- Bookmark Message
- Subscribe to Message
- Mute Message
- Subscribe to RSS Feed
- Permalink
- Report Inappropriate Content

from the docs, it doesn't look like you can rotate data labels.
if this is something you'd like developed, I'd submit an Enhancement Request with Support.
- Mark as New
- Bookmark Message
- Subscribe to Message
- Mute Message
- Subscribe to RSS Feed
- Permalink
- Report Inappropriate Content
Hi Guys,
I need the same thing, as we don't have this as a standard feature we can do it using javascript, however, this is for dashboards not reports.
Steps:
1) Add an ID for your chart editing the source
e.g:
2) create a javascript to update the labels and put them in vertical, of course, this is just an example you can customize by yourself,
Note: Keep the transform value and add the rotate for -90 or other value.
require([
         'jquery',
         'splunkjs/mvc',
         'splunkjs/mvc/simplexml/ready!'
     ], function($,mvc){
        var my_chart = mvc.Components.get("my_chart_id");

        if(my_chart != undefined){
         my_chart.getVisualization(function(chartView) {
             chartView.on("rendered", function() {

                $("#my_chart_id .highcharts-data-labels g").each(function(index){

                    //Used to rotate the label in 90º
                    var transformAttr = $(this).attr('transform');
                    //Avoid add the rotate more than one time
                    if(!transformAttr.includes('rotate'))
                        $(this).attr('transform', transformAttr + 'rotate(-90)');
                 });


             });
         });
    }
});
3) Add the javascript reference in your dashboard,
- Mark as New
- Bookmark Message
- Subscribe to Message
- Mute Message
- Subscribe to RSS Feed
- Permalink
- Report Inappropriate Content
from the docs, it doesn't look like you can rotate data labels.
if this is something you'd like developed, I'd submit an Enhancement Request with Support.



Join the Splunk Community Slack to learn, troubleshoot, and make connections with fellow Splunk practitioners in real time!
Join Splunk User Groups to connect and learn in-person by region or remotely by topic or industry.
Data Management Digest – September 2026
Federated Search for CloudWatch Unified Data Store Is Generally Available
Announcing Modern Navigation: A New Era of Splunk User Experience
