
Join the Conversation
- Find Answers
- :
- Using Splunk
- :
- Dashboards & Visualizations
- :
- Re: Pie chart - Customise the labels Font size
- Subscribe to RSS Feed
- Mark Topic as New
- Mark Topic as Read
- Float this Topic for Current User
- Bookmark Topic
- Subscribe to Topic
- Mute Topic
- Printer Friendly Page
- Mark as New
- Bookmark Message
- Subscribe to Message
- Mute Message
- Subscribe to RSS Feed
- Permalink
- Report Inappropriate Content
Pie chart - Customise the labels Font size

/how to customise the pie chart font size labels
Please post the working snippet
- Mark as New
- Bookmark Message
- Subscribe to Message
- Mute Message
- Subscribe to RSS Feed
- Permalink
- Report Inappropriate Content

- Mark as New
- Bookmark Message
- Subscribe to Message
- Mute Message
- Subscribe to RSS Feed
- Permalink
- Report Inappropriate Content

@Nadhiya, you can try out Simple XML CSS Extension. Provided your pie chart has id="pieChartWithCSS". Following CSS Selector can be used:
       #pieChartWithCSS .highcharts-data-label text tspan{
         font-size:200% !important;
       }
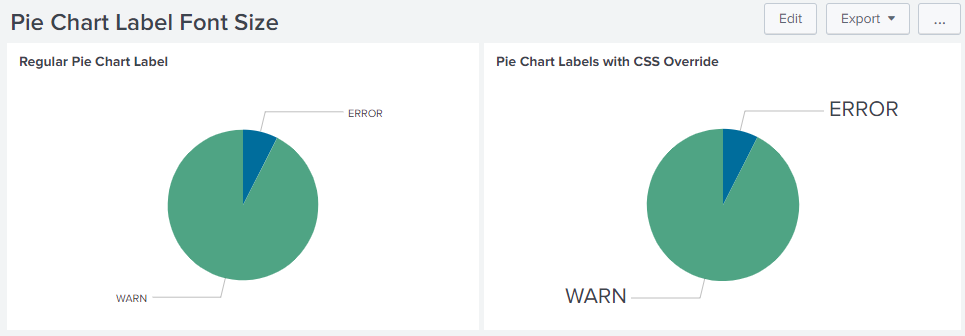

Following is the Simple XML code for run anywhere dashboard:
<dashboard>
  <label>Pie Chart Label Font Size</label>
  <row>
    <panel>
      <chart>
        <title>Regular Pie Chart Label</title>
        <search>
          <query>index=_internal sourcetype=splunkd log_level!=INFO
| stats count by log_level</query>
          <earliest>-8h@h</earliest>
          <latest>now</latest>
          <sampleRatio>1</sampleRatio>
        </search>
        <option name="charting.axisLabelsX.majorLabelStyle.overflowMode">ellipsisNone</option>
        <option name="charting.axisLabelsX.majorLabelStyle.rotation">0</option>
        <option name="charting.axisTitleX.visibility">visible</option>
        <option name="charting.axisTitleY.visibility">visible</option>
        <option name="charting.axisTitleY2.visibility">visible</option>
        <option name="charting.axisX.abbreviation">none</option>
        <option name="charting.axisX.scale">linear</option>
        <option name="charting.axisY.abbreviation">none</option>
        <option name="charting.axisY.scale">linear</option>
        <option name="charting.axisY2.abbreviation">none</option>
        <option name="charting.axisY2.enabled">0</option>
        <option name="charting.axisY2.scale">inherit</option>
        <option name="charting.chart">pie</option>
        <option name="charting.chart.bubbleMaximumSize">50</option>
        <option name="charting.chart.bubbleMinimumSize">10</option>
        <option name="charting.chart.bubbleSizeBy">area</option>
        <option name="charting.chart.nullValueMode">gaps</option>
        <option name="charting.chart.showDataLabels">none</option>
        <option name="charting.chart.sliceCollapsingThreshold">0.01</option>
        <option name="charting.chart.stackMode">default</option>
        <option name="charting.chart.style">minimal</option>
        <option name="charting.drilldown">none</option>
        <option name="charting.layout.splitSeries">0</option>
        <option name="charting.layout.splitSeries.allowIndependentYRanges">0</option>
        <option name="charting.legend.labelStyle.overflowMode">ellipsisMiddle</option>
        <option name="charting.legend.mode">standard</option>
        <option name="charting.legend.placement">right</option>
        <option name="charting.lineWidth">2</option>
        <option name="trellis.enabled">0</option>
        <option name="trellis.scales.shared">1</option>
        <option name="trellis.size">medium</option>
      </chart>
    </panel>
    <panel>
      <html depends="$alwaysHideCSSOverride$">
        <style>
          #pieChartWithCSS .highcharts-data-label text tspan{
            font-size:200% !important;
          }
        </style>
      </html>
      <chart id="pieChartWithCSS">
        <title>Pie Chart Labels with CSS Override</title>
        <search>
          <query>index=_internal sourcetype=splunkd log_level!=INFO
| stats count by log_level</query>
          <earliest>-8h@h</earliest>
          <latest>now</latest>
          <sampleRatio>1</sampleRatio>
        </search>
        <option name="charting.axisLabelsX.majorLabelStyle.overflowMode">ellipsisNone</option>
        <option name="charting.axisLabelsX.majorLabelStyle.rotation">0</option>
        <option name="charting.axisTitleX.visibility">visible</option>
        <option name="charting.axisTitleY.visibility">visible</option>
        <option name="charting.axisTitleY2.visibility">visible</option>
        <option name="charting.axisX.abbreviation">none</option>
        <option name="charting.axisX.scale">linear</option>
        <option name="charting.axisY.abbreviation">none</option>
        <option name="charting.axisY.scale">linear</option>
        <option name="charting.axisY2.abbreviation">none</option>
        <option name="charting.axisY2.enabled">0</option>
        <option name="charting.axisY2.scale">inherit</option>
        <option name="charting.chart">pie</option>
        <option name="charting.chart.bubbleMaximumSize">50</option>
        <option name="charting.chart.bubbleMinimumSize">10</option>
        <option name="charting.chart.bubbleSizeBy">area</option>
        <option name="charting.chart.nullValueMode">gaps</option>
        <option name="charting.chart.showDataLabels">none</option>
        <option name="charting.chart.sliceCollapsingThreshold">0.01</option>
        <option name="charting.chart.stackMode">default</option>
        <option name="charting.chart.style">minimal</option>
        <option name="charting.drilldown">none</option>
        <option name="charting.layout.splitSeries">0</option>
        <option name="charting.layout.splitSeries.allowIndependentYRanges">0</option>
        <option name="charting.legend.labelStyle.overflowMode">ellipsisMiddle</option>
        <option name="charting.legend.mode">standard</option>
        <option name="charting.legend.placement">right</option>
        <option name="charting.lineWidth">2</option>
        <option name="trellis.enabled">0</option>
        <option name="trellis.scales.shared">1</option>
        <option name="trellis.size">medium</option>
      </chart>
    </panel>
  </row>
</dashboard>
| makeresults | eval message= "Happy Splunking!!!"

- Mark as New
- Bookmark Message
- Subscribe to Message
- Mute Message
- Subscribe to RSS Feed
- Permalink
- Report Inappropriate Content
@Nadhiyaa came across this old answer. If your issue was resolved please accept to mark this question as answered and make it more useful for others facing similar issue.
| makeresults | eval message= "Happy Splunking!!!"
- Mark as New
- Bookmark Message
- Subscribe to Message
- Mute Message
- Subscribe to RSS Feed
- Permalink
- Report Inappropriate Content

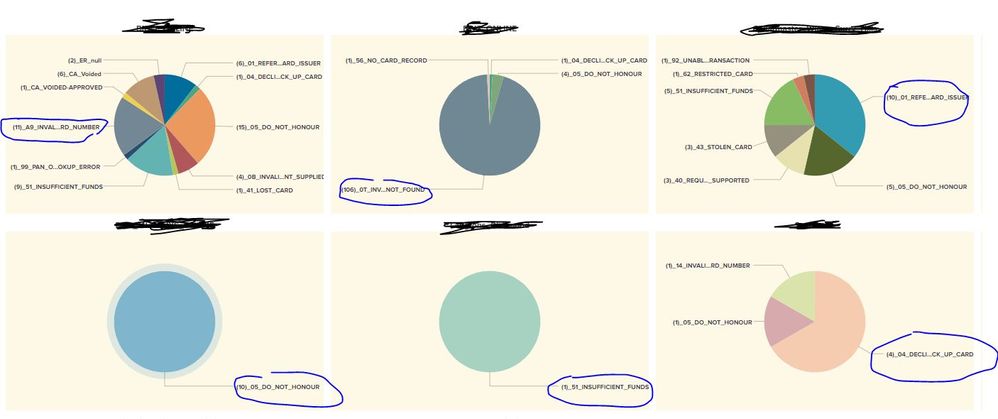
@niketnilay This solution resulted in Overlapping the label text with the single line coming out of the Pie chart. This happens when you have more than one pie chart in a row. Also, I have seen that the increased text gets overlapped with the pie chart slices.
I think this solution is feasible only when you have single pie chart in a row.
- Mark as New
- Bookmark Message
- Subscribe to Message
- Mute Message
- Subscribe to RSS Feed
- Permalink
- Report Inappropriate Content
@niketnilay - Is there a way to make the font of "ERROR" alone bold using CSS?
I have a trellis pie chart and am looking to bold the pies (of each trelli) with maximum count (bigger pie slice)
Thanks
Naresh
- Mark as New
- Bookmark Message
- Subscribe to Message
- Mute Message
- Subscribe to RSS Feed
- Permalink
- Report Inappropriate Content
@nareshinsvu if you ensure that the series labels are always present then you can apply this kind of format using CSS alone. For example in above scenario ERROR will always be series0 (if ERROR is not there its value should be 0) and WARN is series1 due to alphabetical order. You can refer to one such example on Splunk Answers: https://answers.splunk.com/answers/615999/pie-chart-vs-label-colors.html
If series is not fixed i.e. sometimes ERROR will not be there at all then you would need jQuery and SplunkJS for the override as that would be dependent on render of Pie Chart whether ERROR exists or not.
| makeresults | eval message= "Happy Splunking!!!"

Join the Splunk Community Slack to learn, troubleshoot, and make connections with fellow Splunk practitioners in real time!
Join Splunk User Groups to connect and learn in-person by region or remotely by topic or industry.
Announcing Modern Navigation: A New Era of Splunk User Experience
Modernize your Splunk Apps – Introducing Python 3.13 in Splunk
Step into “Hunt the Insider: An Splunk ES Premier Mystery” to catch a cybercriminal ...
