
Join the Conversation
- Find Answers
- :
- Using Splunk
- :
- Dashboards & Visualizations
- :
- Input button to Left Hand Side
- Subscribe to RSS Feed
- Mark Topic as New
- Mark Topic as Read
- Float this Topic for Current User
- Bookmark Topic
- Subscribe to Topic
- Mute Topic
- Printer Friendly Page
- Mark as New
- Bookmark Message
- Subscribe to Message
- Mute Message
- Subscribe to RSS Feed
- Permalink
- Report Inappropriate Content
Input button to Left Hand Side

Hi,
I want to show the input , drop down , checkbox and radio buttons completely in left hand side and my main dashboard data in right hand side, any idea how to do.
- Mark as New
- Bookmark Message
- Subscribe to Message
- Mute Message
- Subscribe to RSS Feed
- Permalink
- Report Inappropriate Content

@sarithapguptha can you add the mock screenshot of what you need? Also what is your current dashboard snippet for inputs?
| makeresults | eval message= "Happy Splunking!!!"
- Mark as New
- Bookmark Message
- Subscribe to Message
- Mute Message
- Subscribe to RSS Feed
- Permalink
- Report Inappropriate Content
I want the dropdown button in the left hand side, not above as shown in the image attached.
I have Host, input type, Input name and error type filters in left side intead of above.

- Mark as New
- Bookmark Message
- Subscribe to Message
- Mute Message
- Subscribe to RSS Feed
- Permalink
- Report Inappropriate Content
If Dropdown and inputs move on the left side (without mock up of expected output I am assuming stacked vertcally) then what will be on the right side? Empty space?
For us to assist you better please provide a mock screenshot of the layout you need. Whiteboard image or paint image will also do.
| makeresults | eval message= "Happy Splunking!!!"
- Mark as New
- Bookmark Message
- Subscribe to Message
- Mute Message
- Subscribe to RSS Feed
- Permalink
- Report Inappropriate Content
I want the filters in left side and the panels in right side, the below shows the panels below the filters which i have now.
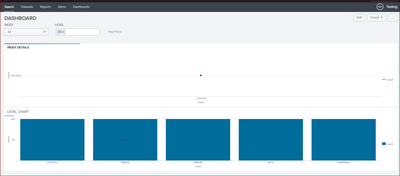
the code is
<form>
<label>DASHBOARD</label>
<fieldset submitButton="false">
<input type="dropdown" token="field3" searchWhenChanged="true">
<label>INDEX</label>
<choice value="*">All</choice>
<default>*</default>
<initialValue>*</initialValue>
<fieldForLabel>index</fieldForLabel>
<fieldForValue>index</fieldForValue>
<search>
<query>index=_internal | stats count by index</query>
<earliest>-24h@h</earliest>
<latest>now</latest>
</search>
</input>
<input type="multiselect" token="field4" searchWhenChanged="true">
<label>LEVEL</label>
<choice value="*">All</choice>
<default>*</default>
<initialValue>*</initialValue>
<fieldForLabel>level</fieldForLabel>
<fieldForValue>level</fieldForValue>
<search>
<query>index=_internal | stats count by level</query>
<earliest>-24h@h</earliest>
<latest>now</latest>
</search>
<delimiter> </delimiter>
</input>
</fieldset>
<row>
<panel>
<chart>
<title>INDEX DETAILS</title>
<search>
<query>index=_internal | stats count by index</query>
<earliest>-24h@h</earliest>
<latest>now</latest>
</search>
<option name="charting.chart">line</option>
<option name="charting.drilldown">none</option>
</chart>
</panel>
</row>
<row>
<panel>
<title>LEVEL CHART</title>
<chart>
<search>
<query>index=_internal | stats count by level</query>
<earliest>-7d@h</earliest>
<latest>now</latest>
<sampleRatio>1</sampleRatio>
</search>
<option name="charting.chart">column</option>
<option name="charting.chart.showDataLabels">all</option>
<option name="charting.chart.stackMode">stacked100</option>
<option name="charting.drilldown">none</option>
</chart>
</panel>
</row>
</form>


Join the Splunk Community Slack to learn, troubleshoot, and make connections with fellow Splunk practitioners in real time!
Join Splunk User Groups to connect and learn in-person by region or remotely by topic or industry.
Rounding off the Splunk Dashboard Contest
A Four Part Event Series: AI + Observability: AI Agents, LLMs, Apps, & Infrastructure
Splunk Technical Support Is Moving to Cisco Support Tools
