Join the Conversation
- Find Answers
- :
- Using Splunk
- :
- Dashboards & Visualizations
- :
- How to show single value + percent of it in chart
- Subscribe to RSS Feed
- Mark Topic as New
- Mark Topic as Read
- Float this Topic for Current User
- Bookmark Topic
- Subscribe to Topic
- Mute Topic
- Printer Friendly Page
- Mark as New
- Bookmark Message
- Subscribe to Message
- Mute Message
- Subscribe to RSS Feed
- Permalink
- Report Inappropriate Content
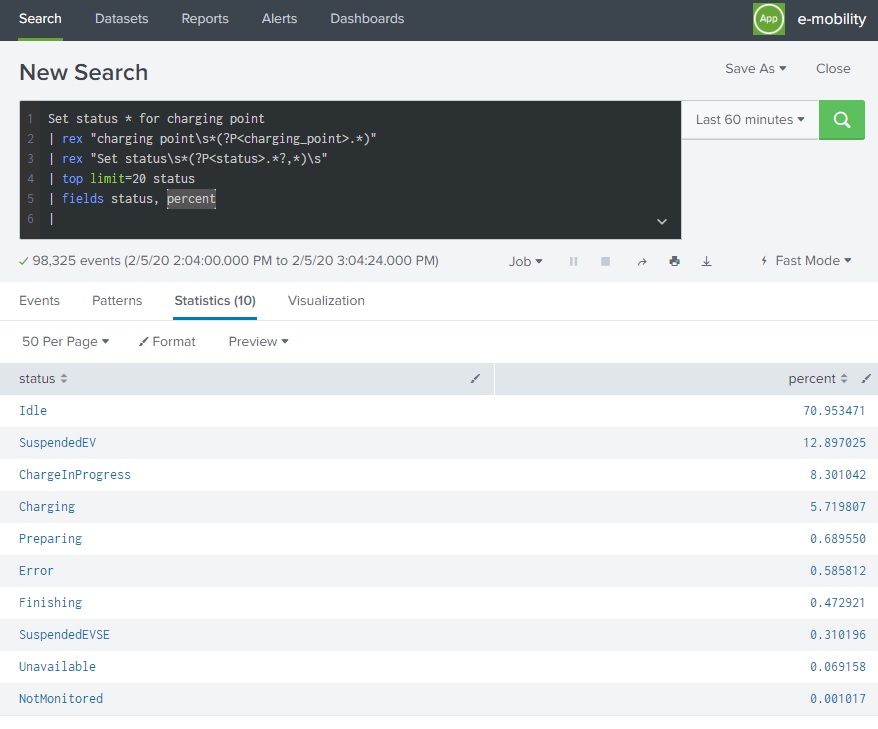
I would like to show each percent of my values sepratly in a dashboard,(Becuse of the SVG input)
How can I do dat ?!
for example I need this : SuspendedEV 12.897025

- Mark as New
- Bookmark Message
- Subscribe to Message
- Mute Message
- Subscribe to RSS Feed
- Permalink
- Report Inappropriate Content
Would adding a filter in your query for status="SuspendedEV" not work?
- Mark as New
- Bookmark Message
- Subscribe to Message
- Mute Message
- Subscribe to RSS Feed
- Permalink
- Report Inappropriate Content
Would adding a filter in your query for status="SuspendedEV" not work?
- Mark as New
- Bookmark Message
- Subscribe to Message
- Mute Message
- Subscribe to RSS Feed
- Permalink
- Report Inappropriate Content
Yes It works I use this commands
| where status="SuspendedEV"
- Mark as New
- Bookmark Message
- Subscribe to Message
- Mute Message
- Subscribe to RSS Feed
- Permalink
- Report Inappropriate Content
Thanks for your help , solved Ja
- Mark as New
- Bookmark Message
- Subscribe to Message
- Mute Message
- Subscribe to RSS Feed
- Permalink
- Report Inappropriate Content
Glad you found your answer. Don't forget to close the question by accepting the answer that worked for you.
- Mark as New
- Bookmark Message
- Subscribe to Message
- Mute Message
- Subscribe to RSS Feed
- Permalink
- Report Inappropriate Content
What are you getting now? And what's the expected? (provide some mock expected output). Are you drilling down from above query? OR just want all % value in separate visualization?
- Mark as New
- Bookmark Message
- Subscribe to Message
- Mute Message
- Subscribe to RSS Feed
- Permalink
- Report Inappropriate Content
No I just need all % value in separate visualization in this case.
- Mark as New
- Bookmark Message
- Subscribe to Message
- Mute Message
- Subscribe to RSS Feed
- Permalink
- Report Inappropriate Content
For example I need % value of "SuspendedEV 12.897025"
and then
| eval percent=round(percent,0)
| fields percent
| `svg_viz_battery_percentage_simple(percent)`
to show that in a SVG battery
like this : 13%
https://drive.google.com/open?id=1AU9wYqdskwK2LCXJnVUzW6uBIRhY9FJj
link text
Splunk Observability for AI
[Puzzles] Solve, Learn, Repeat: Dereferencing XML to Fixed-length events
Stay Connected: Your Guide to December Tech Talks, Office Hours, and Webinars!
