
Join the Conversation
- Find Answers
- :
- Using Splunk
- :
- Dashboards & Visualizations
- :
- Re: TimeChart implementation with DB SQL query
- Subscribe to RSS Feed
- Mark Topic as New
- Mark Topic as Read
- Float this Topic for Current User
- Bookmark Topic
- Subscribe to Topic
- Mute Topic
- Printer Friendly Page
- Mark as New
- Bookmark Message
- Subscribe to Message
- Mute Message
- Subscribe to RSS Feed
- Permalink
- Report Inappropriate Content

I want to implement timechart with span in db sql query. But while implementation, I am getting zero result.
Basically, I want to show count with timechart.
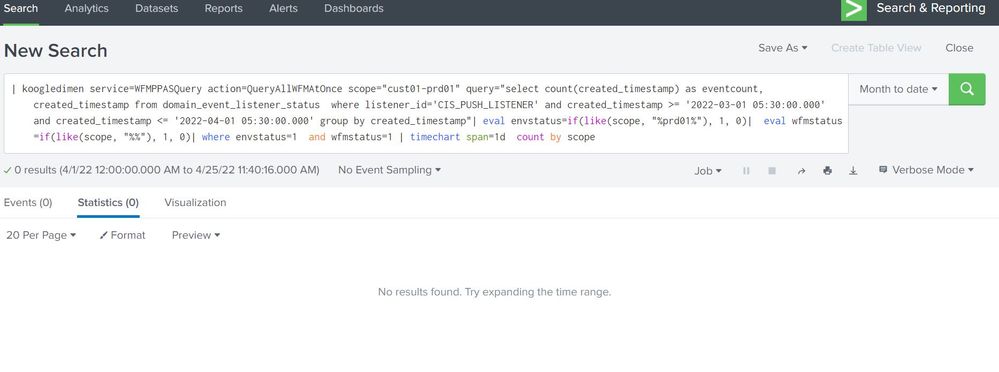
Even, I verified that data is coming with the same query with created_timestamp column.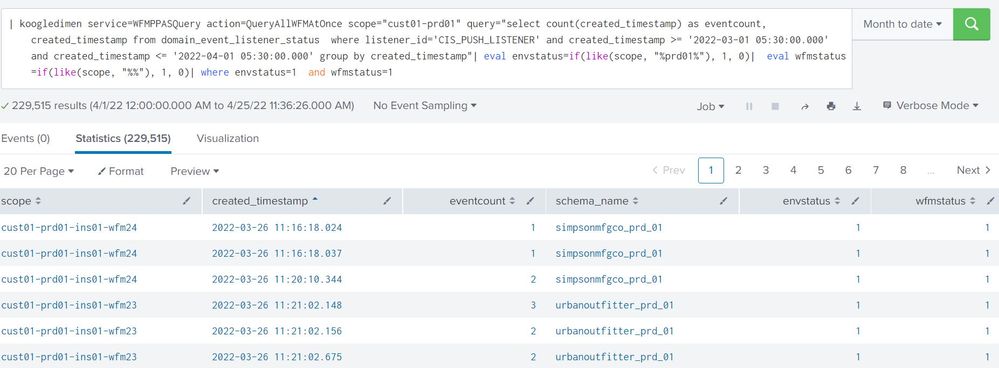
I don't know what step I am doing missing, while using timechart.
- Mark as New
- Bookmark Message
- Subscribe to Message
- Mute Message
- Subscribe to RSS Feed
- Permalink
- Report Inappropriate Content


Timechart relies on a field called _time to hold the epoch timestamp. You need to parse the create time and store it in the _time field. Try something like this
| eval _time=strptime(created_timestamp,"%Y-%m-%d %H:%M:%S.%3N")
- Mark as New
- Bookmark Message
- Subscribe to Message
- Mute Message
- Subscribe to RSS Feed
- Permalink
- Report Inappropriate Content
Timechart relies on a field called _time to hold the epoch timestamp. You need to parse the create time and store it in the _time field. Try something like this
| eval _time=strptime(created_timestamp,"%Y-%m-%d %H:%M:%S.%3N")
- Mark as New
- Bookmark Message
- Subscribe to Message
- Mute Message
- Subscribe to RSS Feed
- Permalink
- Report Inappropriate Content
Thanks @ITWhisperer , Its working now. But I am getting extra date in visualization like 1 Apr to 24 Apr . I only fetched date 1 march to 1April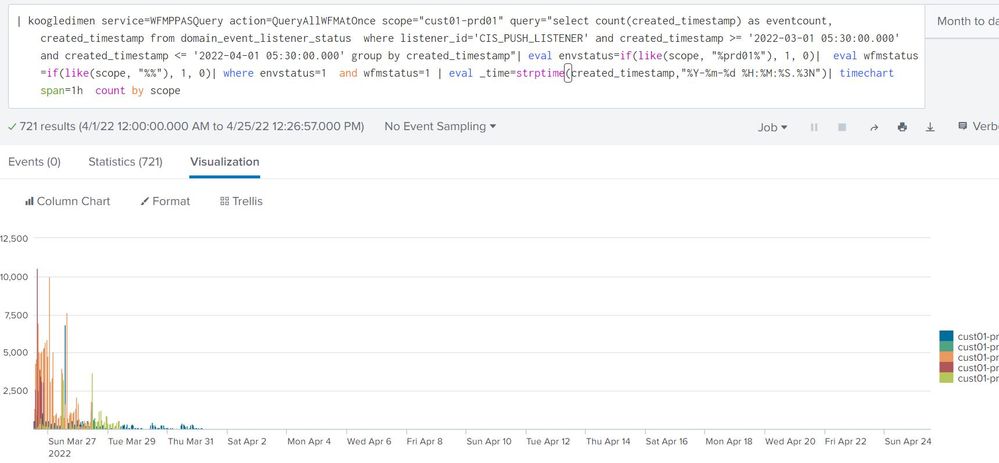
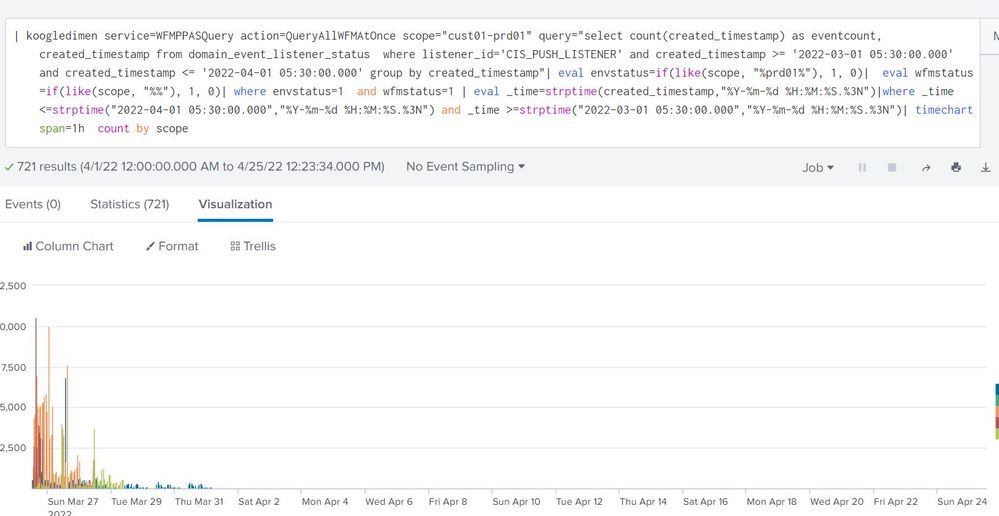
Getting extra date in timechart. Any Solution?
- Mark as New
- Bookmark Message
- Subscribe to Message
- Mute Message
- Subscribe to RSS Feed
- Permalink
- Report Inappropriate Content
Timechart uses the earliest and latest times from the search to determine the size of the x axis

Change the timeframe for the search or create your own chart
| bin span=1h _time
| chart count by _time scope
Join the Splunk Community Slack to learn, troubleshoot, and make connections with fellow Splunk practitioners in real time!
Join Splunk User Groups to connect and learn in-person by region or remotely by topic or industry.
Accelerate Splunk App Development with AI
Splunk Agent Observability: Measuring AI Value with Splunk Tokenomics on AWS
Enterprise Security Watch Party: What’s New in 8.8 - Recap
