
Join the Conversation
- Find Answers
- :
- Using Splunk
- :
- Dashboards & Visualizations
- :
- Re: ScatterPlot Formatting
- Subscribe to RSS Feed
- Mark Topic as New
- Mark Topic as Read
- Float this Topic for Current User
- Bookmark Topic
- Subscribe to Topic
- Mute Topic
- Printer Friendly Page
- Mark as New
- Bookmark Message
- Subscribe to Message
- Mute Message
- Subscribe to RSS Feed
- Permalink
- Report Inappropriate Content
How to do ScatterPlot Formatting?

Team I need help with a Scatter Plot Visualization.
Here's the Search I'm using:
| inputlookup append=t 07012022KPI_Formatted.csv
| eval Deployed=strptime(Deployed, "%m/%d/%y")
| fieldformat Deployed = strftime(Deployed, "%m/%d/%y")
| table "Deployment Success" Deployed "Deploy Lead Time"
It populates the Statistics I'm looking for:
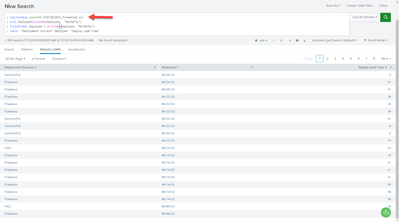
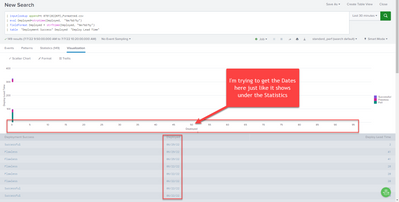
However, when I click Visualization, the Deployed axys is not showing the Dates but as numbers 0.....
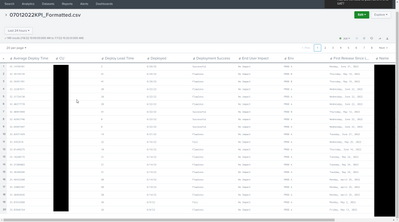
Screenshot for reference of my imported CSV.
Any ideas how to fix it?
Thank you
LK
- Mark as New
- Bookmark Message
- Subscribe to Message
- Mute Message
- Subscribe to RSS Feed
- Permalink
- Report Inappropriate Content


What is it you are attempting to show? Scatter plot against a timeline is perhaps not the right visualisation?
- Mark as New
- Bookmark Message
- Subscribe to Message
- Mute Message
- Subscribe to RSS Feed
- Permalink
- Report Inappropriate Content
ITWhisperer,
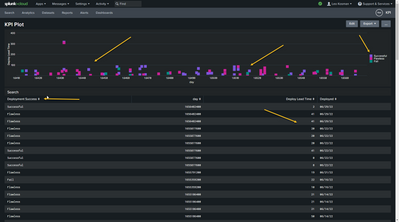
I was asked to use a scatter plot to show:
Vertical (Y) the Deploy Lead Time (amount of time from Development until Production Deploy for a code application)
Horizontal (X) the Date of the Production Deploy.
The Plot should show the status of the Production Deploy of that Date (Flawless, Successful, Fail).
Something like the following screenshot, but notice that I had the day column and no longer use that....
Thank you so much for your time!
- Mark as New
- Bookmark Message
- Subscribe to Message
- Mute Message
- Subscribe to RSS Feed
- Permalink
- Report Inappropriate Content
Unfortunately, the x-axis has to be numeric for a scatter plot, so formatting as a date doesn't work the way you would like.
- Mark as New
- Bookmark Message
- Subscribe to Message
- Mute Message
- Subscribe to RSS Feed
- Permalink
- Report Inappropriate Content
Would you have any recommendation on a good Visualization for it?
Thank you,
LK

Join the Splunk Community Slack to learn, troubleshoot, and make connections with fellow Splunk practitioners in real time!
Join Splunk User Groups to connect and learn in-person by region or remotely by topic or industry.
Meet the .conf26 AI Agent Buildathon Winners
Trusted Autonomy in the SOC: A Maturity Journey
Supercharging Windows Security Detection Performance: Introducing Hybrid Field ...
