Join the Conversation
- Find Answers
- :
- Using Splunk
- :
- Dashboards & Visualizations
- :
- How to apply color based on the field
- Subscribe to RSS Feed
- Mark Topic as New
- Mark Topic as Read
- Float this Topic for Current User
- Bookmark Topic
- Subscribe to Topic
- Mute Topic
- Printer Friendly Page
- Mark as New
- Bookmark Message
- Subscribe to Message
- Mute Message
- Subscribe to RSS Feed
- Permalink
- Report Inappropriate Content
Please help to find out the way to apply color based on field.
my query:
index=<> sourcetype=<>

|timechart count(httpResponsecode) as httpcount by httpResponsecode
Required solution:
Color is not based on count, color is based on field value
if httpResponsecode = 200-299 the count of the httpResponsecode shows in GREEN
httpResponsecode = 300-399 the count of the httpResponsecode shows in GREEN
httpResponsecode = 400-499 the count of the httpResponsecode shows in YELLOW
httpResponsecode = 500-599 the count of the httpResponsecode shows in RED
Note: I'm not looking for trendline and sparkline as well. I just need total count of each httpResponsecode but the count value shown in different color based on the httpResponsecode value.
- Mark as New
- Bookmark Message
- Subscribe to Message
- Mute Message
- Subscribe to RSS Feed
- Permalink
- Report Inappropriate Content
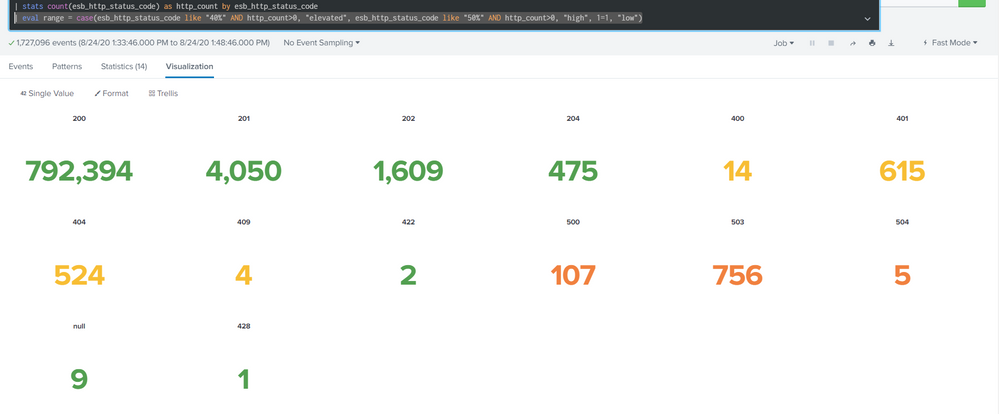
| eval range = case(esb_http_status_code like "40%" AND http_count>0, "elevated", esb_http_status_code like "50%" AND http_count>0, "high", 1=1, "low")
this one worked
- Mark as New
- Bookmark Message
- Subscribe to Message
- Mute Message
- Subscribe to RSS Feed
- Permalink
- Report Inappropriate Content
Hi @rchams,
you have to setup colors in Format Visualization: [Edit -- Format Visualization -- Color -- Use Color=Yes -- Color By Value] settings the value intervals for each color:
        <option name="colorBy">value</option>
        <option name="colorMode">none</option>
        <option name="rangeColors">["0x555","0x53a051","0x53a051","0xf8be34","0xdc4e41","0x555"]</option>
        <option name="rangeValues">[200,299,399,499,599]</option>
        <option name="trendColorInterpretation">standard</option>
        <option name="useColors">1</option>
Ciao.
Giuseppe
- Mark as New
- Bookmark Message
- Subscribe to Message
- Mute Message
- Subscribe to RSS Feed
- Permalink
- Report Inappropriate Content
Hi gcusello,
@gcusello The range logic is not working for colors. I'm looking for colors based on the field value.
httpResponsecode count
200 5
500 6
The range is applying for count not the httpResponsecode.
I'm looking for the result like, if httpResponsecode is 200 the count of the 200 shows in green.
- Mark as New
- Bookmark Message
- Subscribe to Message
- Mute Message
- Subscribe to RSS Feed
- Permalink
- Report Inappropriate Content
| eval range = case(esb_http_status_code like "40%" AND http_count>0, "elevated", esb_http_status_code like "50%" AND http_count>0, "high", 1=1, "low")
this one worked


