
Join the Conversation
- Find Answers
- :
- Using Splunk
- :
- Dashboards & Visualizations
- :
- Re: How do I calculate HTTP failure Percentage?
- Subscribe to RSS Feed
- Mark Topic as New
- Mark Topic as Read
- Float this Topic for Current User
- Bookmark Topic
- Subscribe to Topic
- Mute Topic
- Printer Friendly Page
- Mark as New
- Bookmark Message
- Subscribe to Message
- Mute Message
- Subscribe to RSS Feed
- Permalink
- Report Inappropriate Content

Dear community, I have this:
index=*** sourcetype="*********** " Path=*******"
| stats count by HTTPStatusCode. which will display codes 2**,4**, 5**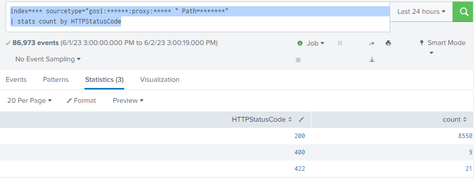
then I used this code to calculate the failure rate
index=***** sourcetype="*****" Path="*****"
| stats count AS Total count(eval(HTTPStatusCode="200")) as Success
| eval Failure = Total - Success | eval Percent_Failure = round((Failure/Total)*100)."%"
| stats count by Percent_Failure 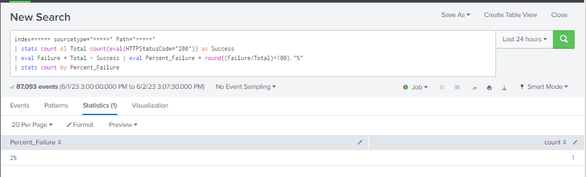
as you can see above it worked fine showing 2% fail rate. so I added it to my "Classic Dashboard" as a SingleValue and all is good. but, to my frustration, when add it to my new Dashboard Studio. it shows this :
singleValue :

but when change it to table type:
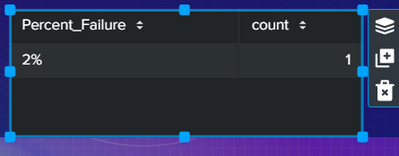
as you can see the logic is correct and it working fine. but why is it refusing to work as singlevalue in the
new dash studio? is it compatibility issue in the new studio? my goal is to is just to display a nice percentage of failures. I need your help please I am new to splunk
thanks,
- Mark as New
- Bookmark Message
- Subscribe to Message
- Mute Message
- Subscribe to RSS Feed
- Permalink
- Report Inappropriate Content


Hi @Abdullaziz19,
Your table is returning two fields: Percent_Failure, and count.
You can make the singe value viz use the "Percent_Failure" field by selecting the following under the "Selected Data Field" option:
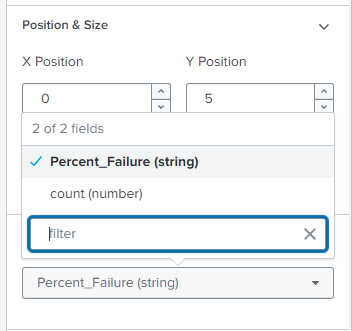
That way you're specifying the right value to use.
Note that you can also add the "%" character in the dashboard options too - just calculate the numeric value you want to display and set the Unit Label to "%". That way you can also round the number automatically, and set thresholds based on its value.

Cheers,
Daniel
- Mark as New
- Bookmark Message
- Subscribe to Message
- Mute Message
- Subscribe to RSS Feed
- Permalink
- Report Inappropriate Content
Hi @Abdullaziz19,
Your table is returning two fields: Percent_Failure, and count.
You can make the singe value viz use the "Percent_Failure" field by selecting the following under the "Selected Data Field" option:
That way you're specifying the right value to use.
Note that you can also add the "%" character in the dashboard options too - just calculate the numeric value you want to display and set the Unit Label to "%". That way you can also round the number automatically, and set thresholds based on its value.
Cheers,
Daniel
- Mark as New
- Bookmark Message
- Subscribe to Message
- Mute Message
- Subscribe to RSS Feed
- Permalink
- Report Inappropriate Content
I followed your steps and it worked like a charm thanks a lot man.


Join the Splunk Community Slack to learn, troubleshoot, and make connections with fellow Splunk practitioners in real time!
Join Splunk User Groups to connect and learn in-person by region or remotely by topic or industry.
Cisco Data Fabric from Architecture to Investigation, Better SOC Visibility, and More ...
The Trust Gap: Why a Data Foundation is Fundamental to an Agentic Enterprise
Data Management Digest – September 2026
