
Join the Conversation
- Find Answers
- :
- Using Splunk
- :
- Dashboards & Visualizations
- :
- Re: How Can I do a simple line graph?
- Subscribe to RSS Feed
- Mark Topic as New
- Mark Topic as Read
- Float this Topic for Current User
- Bookmark Topic
- Subscribe to Topic
- Mute Topic
- Printer Friendly Page
- Mark as New
- Bookmark Message
- Subscribe to Message
- Mute Message
- Subscribe to RSS Feed
- Permalink
- Report Inappropriate Content

Hi,
How Can I do a simple line graph, here is an example:
I got four Fields ( Fruits, June, July, August), like this
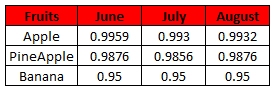
and I want on XAxis( June, July, August) and each fruit must be a serie, like this:

So there is no time fields on this one, so probably I need to use |chart
- Mark as New
- Bookmark Message
- Subscribe to Message
- Mute Message
- Subscribe to RSS Feed
- Permalink
- Report Inappropriate Content

Assuming your data or base search gives a table like in the question, they try this
your base search | table Fruits, June, July, August | untable Fruits Months Value | chart first(Value) over Month by Fruits
Use the line chart as visualization.
- Mark as New
- Bookmark Message
- Subscribe to Message
- Mute Message
- Subscribe to RSS Feed
- Permalink
- Report Inappropriate Content

Can someone explain exactly what is happening when using untable?
- Mark as New
- Bookmark Message
- Subscribe to Message
- Mute Message
- Subscribe to RSS Feed
- Permalink
- Report Inappropriate Content

search should have
| timechart count by fruit
to show line chart
<option name="charting.chart">line</option>
to split series
<option name="charting.layout.splitSeries">1</option>
to show independent Y-Axis ranges
<option name="charting.layout.splitSeries.allowIndependentYRanges">1</option>
- Mark as New
- Bookmark Message
- Subscribe to Message
- Mute Message
- Subscribe to RSS Feed
- Permalink
- Report Inappropriate Content
Assuming your data or base search gives a table like in the question, they try this
your base search | table Fruits, June, July, August | untable Fruits Months Value | chart first(Value) over Month by Fruits
Use the line chart as visualization.
- Mark as New
- Bookmark Message
- Subscribe to Message
- Mute Message
- Subscribe to RSS Feed
- Permalink
- Report Inappropriate Content
That is it!!! well almost, the only thing is: How can I change the order of the months? because, right now is like August -> July -> June!! need to be June -> July -> August.
- Mark as New
- Bookmark Message
- Subscribe to Message
- Mute Message
- Subscribe to RSS Feed
- Permalink
- Report Inappropriate Content
I got it: | sort str(Months) desc
Thank you very much, could you please explain every step?
One more thing, you forgot to put 's' on """""| chart first(Value) over Month"""", can you correct?, is better if someone falls here.




Join the Splunk Community Slack to learn, troubleshoot, and make connections with fellow Splunk practitioners in real time!
Join Splunk User Groups to connect and learn in-person by region or remotely by topic or industry.
Meet Splunk Observability Studio: AI-Assisted OpenTelemetry Instrumentation Without ...
Federated Search for Cisco Security and Analytics Logging (SAL) is now GA on Splunk ...
Your Path to AgenticOps: AI Experiences for Every Splunk Practitioner
