Are you a member of the Splunk Community?
- Find Answers
- :
- Using Splunk
- :
- Dashboards & Visualizations
- :
- [HELP] Need help on configuring Panel Size and Loc...
- Subscribe to RSS Feed
- Mark Topic as New
- Mark Topic as Read
- Float this Topic for Current User
- Bookmark Topic
- Subscribe to Topic
- Mute Topic
- Printer Friendly Page
- Mark as New
- Bookmark Message
- Subscribe to Message
- Mute Message
- Subscribe to RSS Feed
- Permalink
- Report Inappropriate Content
[HELP] Need help on configuring Panel Size and Location with CSS
Hi, I am using Splunk Dashboard with SimpleXML formatting.
This is my Current Code for my Dashboard.
* Query is masked
* The Structure is defined as it is.
  <row>
    <panel>
      <html depends="$alwaysHideCSS$">
<style>
  #table_ref_base{
    width:50% !important;
    float:left !important;
    height: 800px !important;
  }
  #table_ref_red{
    width:50% !important;
    float:right !important;
    height: 400px !important;
  }
  #table_ref_org{
    width:50% !important;
    float:right !important;
    height: 400px !important;
  }

</style>
    </html>
    </panel>
  </row>

  <row>
    <panel id="table_ref_base">
      <table>
        <title>Signals from Week $tk_chosen_start_wk$ ~ Week $tk_chosen_end_wk$</title>
        <search id="search_ref_base">
          <query></query>
          <earliest>$tk_search_start_week$</earliest>
          <latest>$tk_search_end_week$</latest>
        </search>
        <option name="count">30</option>
        <option name="dataOverlayMode">none</option>
        <option name="drilldown">row</option>
        <option name="percentagesRow">false</option>
        <option name="totalsRow">false</option>
        <option name="wrap">true</option>
      </table>
    </panel>
    <panel id="table_ref_red">
      <table>
        <title> (Red) - Critical/Severe Detected (Division_HQ/PG2/Criteria/Value)</title>
        <search base="search_ref_base">
          <query></query>
        </search>
        <option name="count">5</option>
        <option name="refresh.display">progressbar</option>
      </table>
    </panel>
    <panel id="table_ref_org">
      <table>
        <title>🟠 (Orange) - High/Warning Detected (Division_HQ/PG2/Criteria/Value)</title>
        <search base="search_ref_base">
          <query></query>
        </search>
        <option name="count">5</option>
        <option name="refresh.display">progressbar</option>
      </table>
    </panel>
  </row>
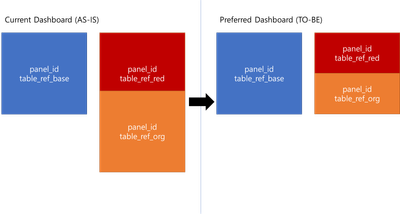
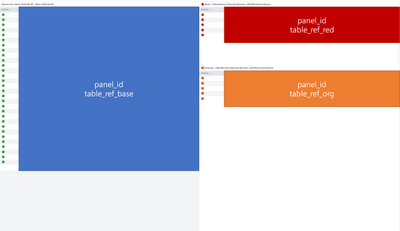
However, my dashboard shows up with this picture below. I thought by defining 800px on the left panel and 400px on both right panel would end up like the preferred dashboard page as above(right), but it gave me a result(left):
Here is also the result of my current Dashboard.
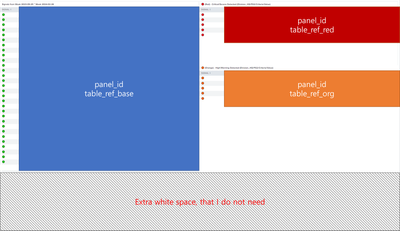
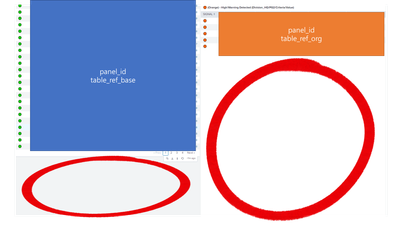
As you can see, It also returns me a needless white space below:
Thanks for your help!
Sincerely,
Chung
- Mark as New
- Bookmark Message
- Subscribe to Message
- Mute Message
- Subscribe to RSS Feed
- Permalink
- Report Inappropriate Content
Hi @jasuchung,
You can take advantage of Simple XML's automatic positioning of multiple visualizations within a panel for automatic alignment and adjust sizes as needed:
<row>
  <panel>
    <table/>
  </panel>
  <panel>
    <table/>
    <table/>
  </panel>
</row>
<dashboard version="1.1" theme="light">
<label>panel_layout</label>
<row depends="$alwaysHideCSS$">
<html>
<style>
#table_ref_base {
height: 800px !important
}
#table_ref_red {
height: 400px !important
}
#table_ref_org {
height: 400px !important
}
</style>
</html>
</row>
<row>
<panel>
<table id="table_ref_base">
<title>table_ref_base</title>
<search>
<query>| makeresults</query>
<earliest>0</earliest>
<latest>now</latest>
</search>
<option name="refresh.display">progressbar</option>
</table>
</panel>
<panel>
<table id="table_ref_red">
<title>table_ref_red</title>
<search>
<query>| makeresults count=15</query>
<earliest>-24h@h</earliest>
<latest>now</latest>
</search>
<option name="refresh.display">progressbar</option>
</table>
<table id="table_ref_org">
<title>table_ref_org</title>
<search>
<query>| makeresults</query>
<earliest>0</earliest>
<latest>now</latest>
</search>
<option name="refresh.display">progressbar</option>
</table>
</panel>
</row>
</dashboard>Whitespace may still be visible depending on the number of results in the table; however, the tables on the right should be divided evenly within the available vertical space.


