
Join the Conversation
- Find Answers
- :
- Using Splunk
- :
- Dashboards & Visualizations
- :
- Re: Grouping results
- Subscribe to RSS Feed
- Mark Topic as New
- Mark Topic as Read
- Float this Topic for Current User
- Bookmark Topic
- Subscribe to Topic
- Mute Topic
- Printer Friendly Page
- Mark as New
- Bookmark Message
- Subscribe to Message
- Mute Message
- Subscribe to RSS Feed
- Permalink
- Report Inappropriate Content
Grouping results


Hi,
I have currently done up a chart using assigned_support_Organization and "age bucket" which is a eval field that I have made as seen in the first image.
I am trying to achieve what I have shown in the second image by having it group by the Ticket Type. Would like to know if there is any function that would allow me to achieve this? Thanks.
Best Regards,
Aloysius
- Mark as New
- Bookmark Message
- Subscribe to Message
- Mute Message
- Subscribe to RSS Feed
- Permalink
- Report Inappropriate Content

@synastraa Try the following steps:
1) Either run multiple searches for each table or use post processing to form two tables out of your table search.
2) Create <html> panel for each table's title which will be displayed on the left.
3) Create 5% and 95% width for title panel and table panel respective.
4) In addition I have rotated the title text to vertical.
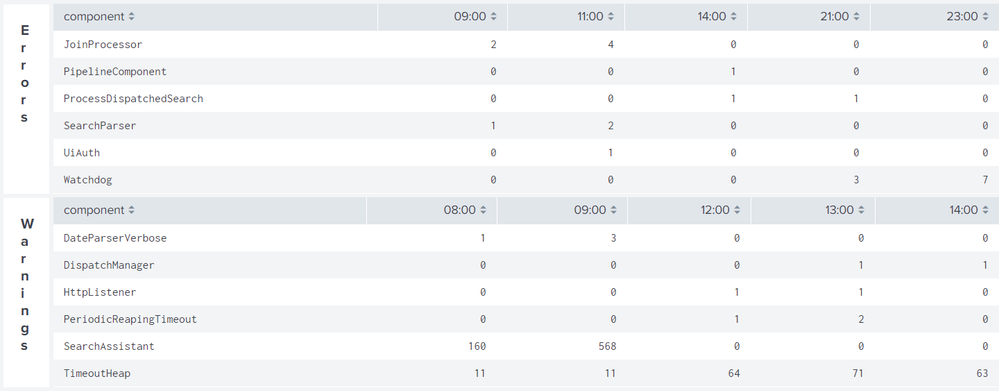
Following is the required Simple XML code for run anywhere example used above:
<dashboard>
  <label>Chart by component over time</label>
  <row>
    <panel id="panelErrorID">
      <html depends="$alwaysHideCSSPanel$">
        <style>
          #panelErrorID,#panelWarnID{
            width:5% !important;
          }
          #panelErrorTable,#panelWarnTable{
            width:95% !important;
          }
          #panelErrorID .htmlPanelTitle,#panelWarnID .htmlPanelTitle{
            font-size: 120%;
            font-weight: bold;
            width: 0;
            word-wrap: break-word;
            padding-left: 30%;
            padding-top: 10px;
          }
        </style>
      </html>
      <html>
        <div class="htmlPanelTitle">Errors</div>
      </html>
    </panel>
    <panel id="panelErrorTable">
      <table>
        <search>
          <query>index=_internal sourcetype=splunkd log_level=ERROR
| eval Time=strftime(_time,"%H").":00"
| chart count by component Time limit=5 useother=f usenull=f</query>
          <earliest>-24h@h</earliest>
          <latest>now</latest>
          <sampleRatio>1</sampleRatio>
        </search>
        <option name="count">20</option>
        <option name="dataOverlayMode">none</option>
        <option name="drilldown">none</option>
        <option name="percentagesRow">false</option>
        <option name="refresh.display">progressbar</option>
        <option name="rowNumbers">false</option>
        <option name="totalsRow">false</option>
        <option name="wrap">true</option>
      </table>
    </panel>
  </row>
  <row>
    <panel id="panelWarnID">
      <html>
        <div class="htmlPanelTitle">Warnings</div>
      </html>
    </panel>
    <panel id="panelWarnTable">
      <table>
        <search>
          <query>index=_internal sourcetype=splunkd log_level=WARN
| eval Time=strftime(_time,"%H").":00"
| chart count by component Time limit=5 useother=f usenull=f</query>
          <earliest>-24h@h</earliest>
          <latest>now</latest>
          <sampleRatio>1</sampleRatio>
        </search>
        <option name="count">20</option>
        <option name="dataOverlayMode">none</option>
        <option name="drilldown">none</option>
        <option name="percentagesRow">false</option>
        <option name="refresh.display">progressbar</option>
        <option name="rowNumbers">false</option>
        <option name="totalsRow">false</option>
        <option name="wrap">true</option>
      </table>
    </panel>
  </row>
</dashboard>
| makeresults | eval message= "Happy Splunking!!!"




Join the Splunk Community Slack to learn, troubleshoot, and make connections with fellow Splunk practitioners in real time!
Join Splunk User Groups to connect and learn in-person by region or remotely by topic or industry.
SOC4Kafka - New Kafka Connector Powered by OpenTelemetry
Event Series: Level up your SOC: Advancing with Splunk Enterprise Security
Announcing Modern Navigation: A New Era of Splunk User Experience
