
Join the Conversation
- Find Answers
- :
- Using Splunk
- :
- Dashboards & Visualizations
- :
- Get the last _raw events - JSON file
- Subscribe to RSS Feed
- Mark Topic as New
- Mark Topic as Read
- Float this Topic for Current User
- Bookmark Topic
- Subscribe to Topic
- Mute Topic
- Printer Friendly Page
- Mark as New
- Bookmark Message
- Subscribe to Message
- Mute Message
- Subscribe to RSS Feed
- Permalink
- Report Inappropriate Content

Hi crew,
I have a JSON file from Vulnerability services generated one time per hour, and I just needed to get the last _raw event. How is it possible? I want to show the data from the last 7 or 15 days using this condiction.
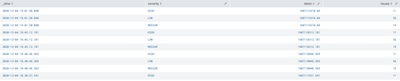
| rename Issues{}.details AS details Issues{}.file AS file Issues{}.severity AS severity Issues{}.confidence AS confidence Issues{}.line AS line
| eval tempField=mvzip(mvzip(mvzip(mvzip(details, file), severity), confidence), line)
| stats count by _time, service, source, tempField
| eval details=mvindex(split(tempField,","),0), file=mvindex(split(tempField,","),1), severity=mvindex(split(tempField,","),2), confidence=mvindex(split(tempField,","),3), line=mvindex(split(tempField, ","),4)
| stats max(_time) AS latest, count AS Issues by _time, severity
| sort - _time
- Mark as New
- Bookmark Message
- Subscribe to Message
- Mute Message
- Subscribe to RSS Feed
- Permalink
- Report Inappropriate Content
Well, crew! Splunk showed the two latest events, so I followed a tip to send these events to a lookup table and use this lookup table to transform and present the data! It's working fine and with good performance. Thank you all.
- Mark as New
- Bookmark Message
- Subscribe to Message
- Mute Message
- Subscribe to RSS Feed
- Permalink
- Report Inappropriate Content
Well, crew! Splunk showed the two latest events, so I followed a tip to send these events to a lookup table and use this lookup table to transform and present the data! It's working fine and with good performance. Thank you all.
- Mark as New
- Bookmark Message
- Subscribe to Message
- Mute Message
- Subscribe to RSS Feed
- Permalink
- Report Inappropriate Content

If you just want the latest _raw value in a time period you can just use latest(_raw) in your stats. Here's an example:
| rename Issues{}.details AS details Issues{}.file AS file Issues{}.severity AS severity Issues{}.confidence AS confidence Issues{}.line AS line
| eval tempField=mvzip(mvzip(mvzip(mvzip(details, file), severity), confidence), line)
| stats count latest(_raw) as example by _time, service, source, tempField
| eval details=mvindex(split(tempField,","),0), file=mvindex(split(tempField,","),1), severity=mvindex(split(tempField,","),2), confidence=mvindex(split(tempField,","),3), line=mvindex(split(tempField, ","),4)
| stats max(_time) AS latest, count AS Issues latest(example) as example by _time, severity
| sort - _time- Mark as New
- Bookmark Message
- Subscribe to Message
- Mute Message
- Subscribe to RSS Feed
- Permalink
- Report Inappropriate Content

Your question is not totally clear, but I wonder if you mean "Can I also display the vulnerability details"?
In which case you could try replacing the last stats with:
| stats max(_time) AS latest, count AS Issues by _time, severity, details
or
| stats max(_time) AS latest, count AS Issues by _time, severity, details, file, lineif you want all the fields
- Mark as New
- Bookmark Message
- Subscribe to Message
- Mute Message
- Subscribe to RSS Feed
- Permalink
- Report Inappropriate Content

What's _raw event?


Join the Splunk Community Slack to learn, troubleshoot, and make connections with fellow Splunk practitioners in real time!
Join Splunk User Groups to connect and learn in-person by region or remotely by topic or industry.
Best Practices: Splunk auto adjust pipeline queue
Splunk Auto Ingestion Parallel Pipeline Scaling
A Four-Part Event Series: Full Stack Observability For the AI Era
