
Join the Conversation
- Find Answers
- :
- Using Splunk
- :
- Dashboards & Visualizations
- :
- Dashboard line chart with dynamic time interval
- Subscribe to RSS Feed
- Mark Topic as New
- Mark Topic as Read
- Float this Topic for Current User
- Bookmark Topic
- Subscribe to Topic
- Mute Topic
- Printer Friendly Page
- Mark as New
- Bookmark Message
- Subscribe to Message
- Mute Message
- Subscribe to RSS Feed
- Permalink
- Report Inappropriate Content

I have a search roughly equivalent to this:
...
| eval TimeHour=strftime(_time,"%Y-%m-%d %H:00:00")
| eval TimeDay=strftime(_time,"%Y-%m-%d")
| eval TimeWeek=strftime(_time,"%Y-%V")
| stats dc(transactionId) as "Users" by TimeHour, TimeDay, TimeWeek
I want to create a line chart that allows the user to choose to group by hour, day, or week. What's the best way to achieve that? Maybe a string "date" isn't the right way to go. In any event, can I change which field from a search is the X axis rather than defaulting to something random? I'm frustrated with the lack of flexibility in visualizations.
Thanks!
- Mark as New
- Bookmark Message
- Subscribe to Message
- Mute Message
- Subscribe to RSS Feed
- Permalink
- Report Inappropriate Content


You would use tokens in the dashboard and when the user selects the appropriate period from your choice and do something like
...
| timechart span=$user_selected_time_span$ dc(transactionId) as "Users"
where in your dropdown the values for the selections are
1h@h, 1d@d 1w@w
and the token assigned to that input is user_selected_time_span
so, then when the user changes the dropdown, it will redisplay the selected period
- Mark as New
- Bookmark Message
- Subscribe to Message
- Mute Message
- Subscribe to RSS Feed
- Permalink
- Report Inappropriate Content
You would use tokens in the dashboard and when the user selects the appropriate period from your choice and do something like
...
| timechart span=$user_selected_time_span$ dc(transactionId) as "Users"
where in your dropdown the values for the selections are
1h@h, 1d@d 1w@w
and the token assigned to that input is user_selected_time_span
so, then when the user changes the dropdown, it will redisplay the selected period
- Mark as New
- Bookmark Message
- Subscribe to Message
- Mute Message
- Subscribe to RSS Feed
- Permalink
- Report Inappropriate Content
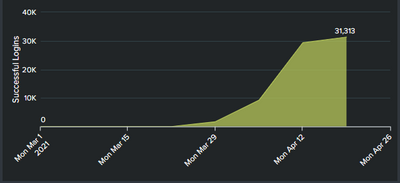
Thanks so much. With a little tinkering this turned out great! My only remaining question is around the last period being displayed. I always get an empty last entry on the X axis. Any thoughts? Wondering if it has anything to do with the "snap to" start of week option?
<panel>
      <title>XXX</title>
      <chart>
        <search>
          <query>index=XXX
earliest=$time_token.earliest$
latest=$time_token.latest$
...
| rename http.request.queryParameters.authIndexValue{} as "Successful Logins"
| timechart span=$time_span$ count("Successful Logins") as "Successful Logins"</query>
          <earliest>$time_token.earliest$</earliest>
          <latest>$time_token.latest$</latest>
          <sampleRatio>1</sampleRatio>
        </search>
        <option name="charting.axisLabelsX.majorLabelStyle.rotation">-45</option>
        <option name="charting.axisTitleX.visibility">collapsed</option>
        <option name="charting.axisY.abbreviation">auto</option>
        <option name="charting.chart">area</option>
        <option name="charting.chart.showDataLabels">minmax</option>
        <option name="charting.drilldown">none</option>
        <option name="charting.legend.placement">none</option>
        <option name="refresh.display">progressbar</option>
      </chart>
    </panel>
<input type="radio" token="time_span" searchWhenChanged="true">
<label>Time Span</label>
<choice value="w@w1">By Week</choice>
<choice value="d@d1">By Day</choice>
<choice value="h@h1">By Hour</choice>
<search>
<query/>
<earliest>-7d</earliest>
<latest>now</latest>
</search>
<default>w@w1</default>
<initialValue>w@w1</initialValue>
</input>
<input type="time" token="time_token" searchWhenChanged="true">
<label>Date Range</label>
<default>
<earliest>-6w@w</earliest>
<latest>now</latest>
</default>
</input>

Join the Splunk Community Slack to learn, troubleshoot, and make connections with fellow Splunk practitioners in real time!
Join Splunk User Groups to connect and learn in-person by region or remotely by topic or industry.
Agent Mode Engaged! Enchaining Agentic Operations with Splunk AI Assistant 2.0
Announcing Modern Navigation: A New Era of Splunk User Experience
Modernize your Splunk Apps – Introducing Python 3.13 in Splunk
