
Join the Conversation
- Find Answers
- :
- Using Splunk
- :
- Dashboards & Visualizations
- :
- Re: Customized Bubble Chart without converting to ...
- Subscribe to RSS Feed
- Mark Topic as New
- Mark Topic as Read
- Float this Topic for Current User
- Bookmark Topic
- Subscribe to Topic
- Mute Topic
- Printer Friendly Page
- Mark as New
- Bookmark Message
- Subscribe to Message
- Mute Message
- Subscribe to RSS Feed
- Permalink
- Report Inappropriate Content
Customized Bubble Chart without converting to HTML

Hi All!
Just want to ask if it is possible to do this kind of Bubble Chart in Splunk without converting to HTML?
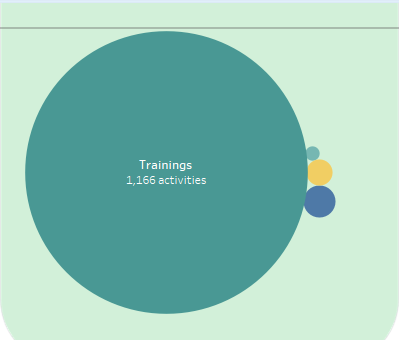
Thanks in advance! 🙂
- Mark as New
- Bookmark Message
- Subscribe to Message
- Mute Message
- Subscribe to RSS Feed
- Permalink
- Report Inappropriate Content

Hi jvmerilla,
straight out I would say that you are able to build this visualization without converting your dashboard to html.
Option No.1: There could already be a custom visualization on splunkbase for you to download and use.
https://splunkbase.splunk.com/apps/#/app_content/visualizations
Option No.2: You could download the splunk dashboard examples app and maybe adjust a visualization there using java-script.
https://splunkbase.splunk.com/app/1603/
Option No.3: You could start writing your own custom visualization with java-script by using this handy tutorial.
https://docs.splunk.com/Documentation/SplunkCloud/6.6.3/AdvancedDev/CustomVizTutorial
- Mark as New
- Bookmark Message
- Subscribe to Message
- Mute Message
- Subscribe to RSS Feed
- Permalink
- Report Inappropriate Content
- Mark as New
- Bookmark Message
- Subscribe to Message
- Mute Message
- Subscribe to RSS Feed
- Permalink
- Report Inappropriate Content

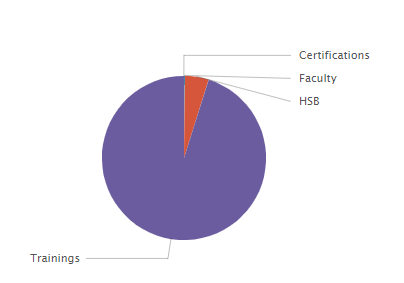
you can not use default bubble chart shipped with Splunk for this as bubble chart normally require 3 fields. You can use donut chart instead. If you are interested then I can tell you about that
If you want to use bubble chart then you have to write javascript and all.
- Mark as New
- Bookmark Message
- Subscribe to Message
- Mute Message
- Subscribe to RSS Feed
- Permalink
- Report Inappropriate Content
what is your search query?
as this is a chart so you need 3 columns as in x-axis(mostly time) y-axis(mostly count) and third count




Join the Splunk Community Slack to learn, troubleshoot, and make connections with fellow Splunk practitioners in real time!
Join Splunk User Groups to connect and learn in-person by region or remotely by topic or industry.
Developer Spotlight with Denis Gladkikh
Governing Enterprise AI, Bringing Cisco Telemetry Home, and More from Splunk Lantern
Agentic SOC Triage: Investigating Splunk ES Notables with MCP Server and a Local LLM
