
Join the Conversation
- Find Answers
- :
- Using Splunk
- :
- Dashboards & Visualizations
- :
- Re: Create dashboard and relatorio
- Subscribe to RSS Feed
- Mark Topic as New
- Mark Topic as Read
- Float this Topic for Current User
- Bookmark Topic
- Subscribe to Topic
- Mute Topic
- Printer Friendly Page
- Mark as New
- Bookmark Message
- Subscribe to Message
- Mute Message
- Subscribe to RSS Feed
- Permalink
- Report Inappropriate Content
Create dashboard and relatorio

Hello,
I would like to create 03 reports, but I have difficulties.
What happens, I need to create:
- Calls that are not answered by extension;
- Calls that are answered by extension successfully;
- Calls made by extension successfully;
- Unsuccessful extension calls;
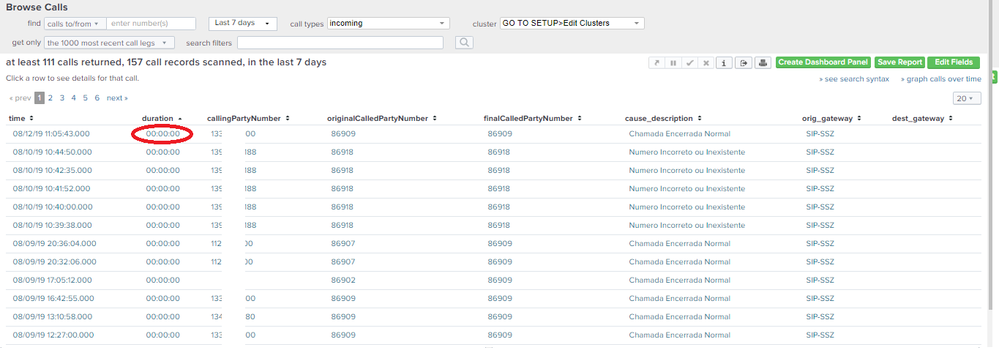
But I notice that I can't filter by time, because there are links
00:00:00, so I can't create a report using just the "status" of the call because it usually has "normal clean call".
It is possible to make a query in the way that, define that the calls "received" by time, and consider that with the value 00:00:00 s;
Att,
Richard
- Mark as New
- Bookmark Message
- Subscribe to Message
- Mute Message
- Subscribe to RSS Feed
- Permalink
- Report Inappropriate Content


Perhaps this will get you started.
index=foo duration="00:00:00" cause_description=* | table _time cause_description
If this reply helps you, Karma would be appreciated.
- Mark as New
- Bookmark Message
- Subscribe to Message
- Mute Message
- Subscribe to RSS Feed
- Permalink
- Report Inappropriate Content
I could not resolve with this condition
- Mark as New
- Bookmark Message
- Subscribe to Message
- Mute Message
- Subscribe to RSS Feed
- Permalink
- Report Inappropriate Content
What do you get? Did you make any necessary changes for your environment (correct index and field names) ?
If this reply helps you, Karma would be appreciated.
- Mark as New
- Bookmark Message
- Subscribe to Message
- Mute Message
- Subscribe to RSS Feed
- Permalink
- Report Inappropriate Content
- Mark as New
- Bookmark Message
- Subscribe to Message
- Mute Message
- Subscribe to RSS Feed
- Permalink
- Report Inappropriate Content
It would help if you shared some sample events, sanitized as necessary.
If this reply helps you, Karma would be appreciated.
- Mark as New
- Bookmark Message
- Subscribe to Message
- Mute Message
- Subscribe to RSS Feed
- Permalink
- Report Inappropriate Content
It is possible to create a query, containing only calls with "zero duration" and the cause of the call.
"cause_description"?



Join the Splunk Community Slack to learn, troubleshoot, and make connections with fellow Splunk practitioners in real time!
Join Splunk User Groups to connect and learn in-person by region or remotely by topic or industry.
Persistent Queue at TcpOut — One of Splunk's Most Practical Features
Skip the Awkward Silence: Have a .conf-ersation at .conf26
Rethinking Zero Trust: From Product Purchases to Logical Control Evidence
