Turn on suggestions
Auto-suggest helps you quickly narrow down your search results by suggesting possible matches as you type.
Showing results for
Dashboards & Visualizations
Turn on suggestions
Auto-suggest helps you quickly narrow down your search results by suggesting possible matches as you type.
Showing results for
- Splunk Answers
- :
- Using Splunk
- :
- Dashboards & Visualizations
- :
- Controlling X Axis major tick labels in area chart...
Options
- Subscribe to RSS Feed
- Mark Topic as New
- Mark Topic as Read
- Float this Topic for Current User
- Bookmark Topic
- Subscribe to Topic
- Mute Topic
- Printer Friendly Page
- Mark as New
- Bookmark Message
- Subscribe to Message
- Mute Message
- Subscribe to RSS Feed
- Permalink
- Report Inappropriate Content
Controlling X Axis major tick labels in area charts
chiliconbeano
Path Finder
08-11-2021
12:07 PM
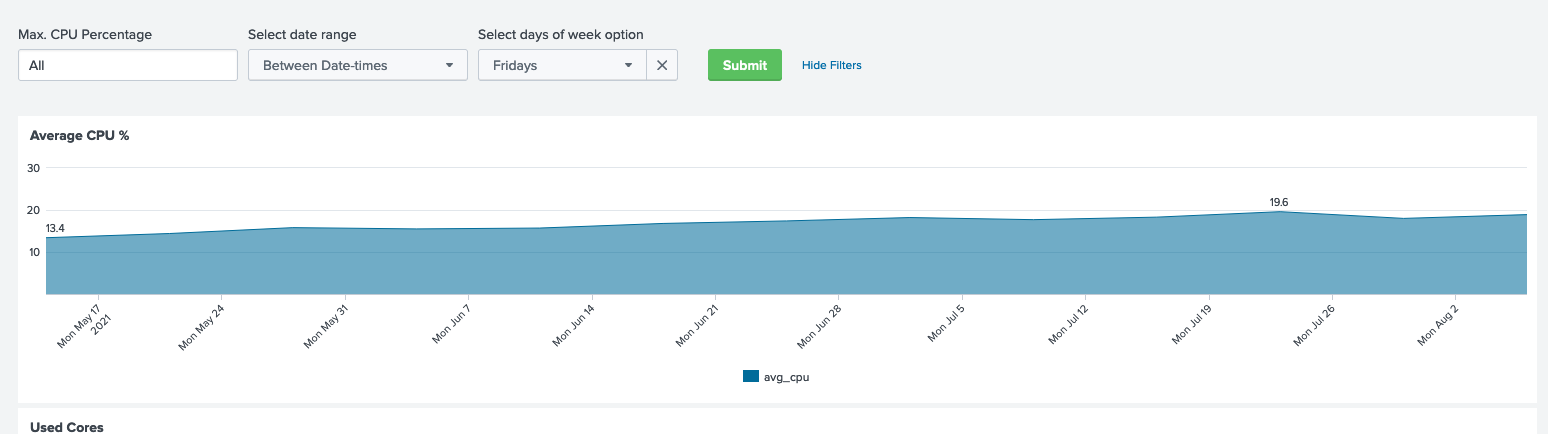
By default, when you chart by '_time', the major ticks displayed over a multiple week time span always uses Mondays in the major tick labels. Since I am allowing people to select individual days of the week for week over week comparisons, it would be nice to show the selected day of the week as the major tick label.
Is there a charting control variable that can be used for this?
thanks in advance,
Bob Eubanks
In the attached screen shot, the user has selected 'Fridays' for comparison, yet the chart uses Mondays as the major tick label.
Get Updates on the Splunk Community!
Stay Connected: Your Guide to May Tech Talks, Office Hours, and Webinars!
Take a look below to explore our upcoming Community Office Hours, Tech Talks, and Webinars this month. This ...
They're back! Join the SplunkTrust and MVP at .conf24
With our highly anticipated annual conference, .conf, comes the fez-wearers you can trust! The SplunkTrust, as ...
Enterprise Security Content Update (ESCU) | New Releases
Last month, the Splunk Threat Research Team had two releases of new security content via the Enterprise ...
