Turn on suggestions
Auto-suggest helps you quickly narrow down your search results by suggesting possible matches as you type.
Dashboards & Visualizations
×
Are you a member of the Splunk Community?
Sign in or Register with your Splunk account to get your questions answered, access valuable resources and connect with experts!
Turn on suggestions
Auto-suggest helps you quickly narrow down your search results by suggesting possible matches as you type.
- Find Answers
- :
- Using Splunk
- :
- Dashboards & Visualizations
- :
- Controlling X Axis major tick labels in area chart...
Options
- Subscribe to RSS Feed
- Mark Topic as New
- Mark Topic as Read
- Float this Topic for Current User
- Bookmark Topic
- Subscribe to Topic
- Mute Topic
- Printer Friendly Page
- Mark as New
- Bookmark Message
- Subscribe to Message
- Mute Message
- Subscribe to RSS Feed
- Permalink
- Report Inappropriate Content
Controlling X Axis major tick labels in area charts
chiliconbeano
Path Finder
08-11-2021
12:07 PM
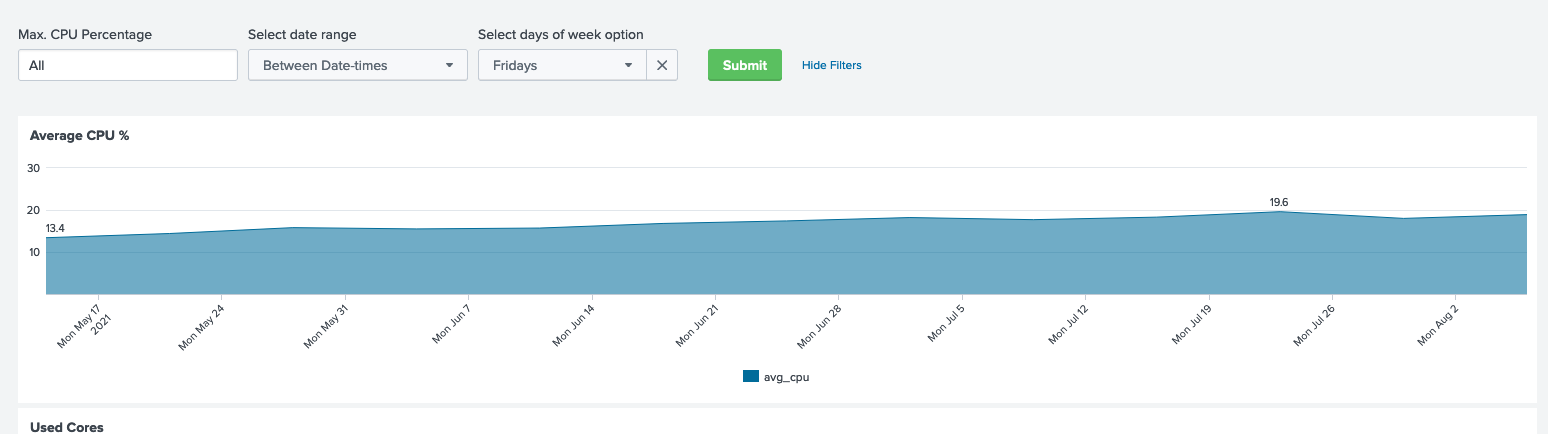
By default, when you chart by '_time', the major ticks displayed over a multiple week time span always uses Mondays in the major tick labels. Since I am allowing people to select individual days of the week for week over week comparisons, it would be nice to show the selected day of the week as the major tick label.
Is there a charting control variable that can be used for this?
thanks in advance,
Bob Eubanks
In the attached screen shot, the user has selected 'Fridays' for comparison, yet the chart uses Mondays as the major tick label.
Get Updates on the Splunk Community!
Index This | When is October more than just the tenth month?
October 2025 Edition
Hayyy Splunk Education Enthusiasts and the Eternally Curious!
We’re back with this ...
Observe and Secure All Apps with Splunk
Join Us for Our Next Tech Talk: Observe and Secure All Apps with SplunkAs organizations continue to innovate ...
What’s New & Next in Splunk SOAR
Security teams today are dealing with more alerts, more tools, and more pressure than ever. Join us for an ...
