Turn on suggestions
Auto-suggest helps you quickly narrow down your search results by suggesting possible matches as you type.
Dashboards & Visualizations
×
Join the Conversation
Without signing in, you're just watching from the sidelines. Sign in or Register to connect, share, and be part of the Splunk Community.
- Find Answers
- :
- Using Splunk
- :
- Dashboards & Visualizations
- :
- Re: Add trendline to timechart splunk
Options
- Subscribe to RSS Feed
- Mark Topic as New
- Mark Topic as Read
- Float this Topic for Current User
- Bookmark Topic
- Subscribe to Topic
- Mute Topic
- Printer Friendly Page
- Mark as New
- Bookmark Message
- Subscribe to Message
- Mute Message
- Subscribe to RSS Feed
- Permalink
- Report Inappropriate Content
karthi25
Path Finder
01-04-2018
04:01 AM
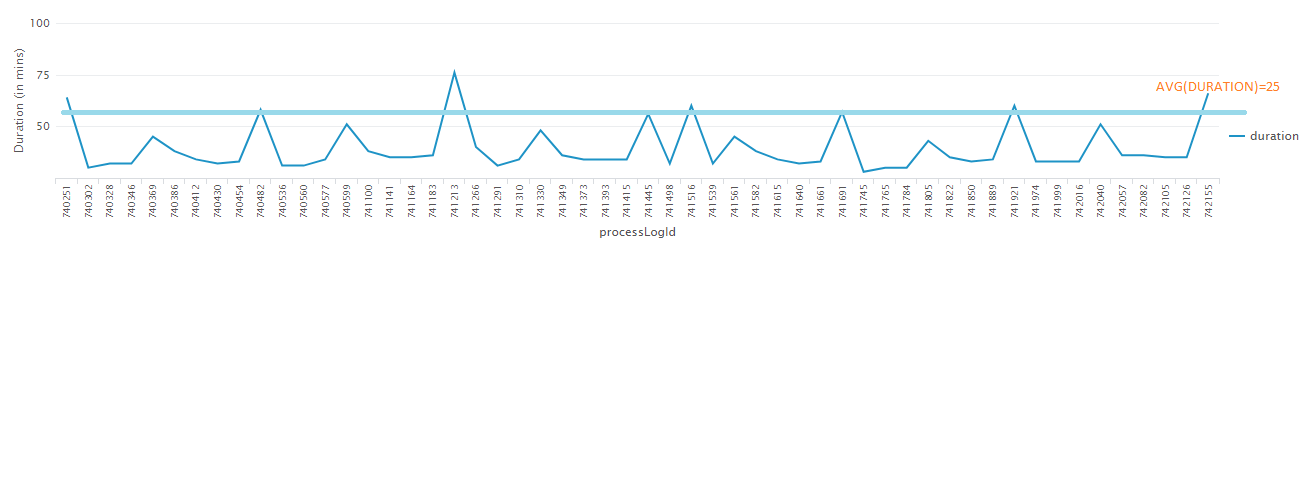
I am having the chart with durations, Now I want add a line over the chart with values as avg(duration). I used below query, but its not showing up trendline
index=cloudfoundry sourcetype=cloudfoundry_apps "cf_foundation=px-npe01" "cf_org_name=Commissions" "cf_space_name=development" "cf_app_name=splunk**   |search endDate !=null AND status='COMPLETED' |eval start_epoch=strptime(startDate,"%Y-%m-%d %H:%M:%S.%1N")
     |eval _time=start_epoch
     |eval end_epoch=strptime(endDate,"%Y-%m-%d %H:%M:%S.%1N")
     |eval duration=round((end_epoch-start_epoch)/3600)
      | chart values(duration) as duration by processLogId | trendline sma5(duration) as sma_Max_Resp
My expectation will be as follows

1 Solution
- Mark as New
- Bookmark Message
- Subscribe to Message
- Mute Message
- Subscribe to RSS Feed
- Permalink
- Report Inappropriate Content
mayurr98
Super Champion
01-04-2018
04:43 AM
hey try this!
index=cloudfoundry sourcetype=cloudfoundry_apps "cf_foundation=px-npe01" "cf_org_name=Commissions" "cf_space_name=development" "cf_app_name=splunk**
|search endDate !=null AND status='COMPLETED' |eval start_epoch=strptime(startDate,"%Y-%m-%d %H:%M:%S.%1N")
      |eval _time=start_epoch
      |eval end_epoch=strptime(endDate,"%Y-%m-%d %H:%M:%S.%1N")
      |eval duration=round((end_epoch-start_epoch)/3600)
       | chart values(duration) as duration by processLogId | eventstats avg(duration) as avg_duration
just add eventstats avg(duration) as avg_duration at the end of your query instead of trendline command.
let me know if this helps you!
- Mark as New
- Bookmark Message
- Subscribe to Message
- Mute Message
- Subscribe to RSS Feed
- Permalink
- Report Inappropriate Content
karthi25
Path Finder
01-05-2018
03:22 AM
@mayurr98 if I want a line in a column chart.. What can I do?? I tried changing the chart type but that average is in a bar shape not a line
- Mark as New
- Bookmark Message
- Subscribe to Message
- Mute Message
- Subscribe to RSS Feed
- Permalink
- Report Inappropriate Content
mayurr98
Super Champion
01-05-2018
03:39 AM
as per my knowledge, it will not create a line in column chart this solution is only meant for line chart!
Got questions? Get answers!
Join the Splunk Community Slack to learn, troubleshoot, and make connections with fellow Splunk practitioners in real time!
Meet up IRL or virtually!
Join Splunk User Groups to connect and learn in-person by region or remotely by topic or industry.
Get Updates on the Splunk Community!
Index This | What travels the world but is also stuck in place?
April 2026 Edition
Hayyy Splunk Education Enthusiasts and the Eternally Curious!
We’re back with this ...
Discover New Use Cases: Unlock Greater Value from Your Existing Splunk Data
Realizing the full potential of your Splunk investment requires more than just understanding current usage; it ...
Continue Your Journey: Join Session 2 of the Data Management and Federation Bootcamp ...
As data volumes continue to grow and environments become more distributed, managing and optimizing data ...
