Join the Conversation
- Blogs
- :
- Community Blog
- :
- How I Instrumented a Rust Application Without Know...
How I Instrumented a Rust Application Without Knowing Rust
- Subscribe to RSS Feed
- Mark as New
- Mark as Read
- Bookmark Topic
- Subscribe
- Printer Friendly Page
- Report Inappropriate Content
As a technical writer, I often have to edit or create code snippets for Splunk's distributions of OpenTelemetry instrumentation. This requires some basic knowledge of each programming language and its development environment, as well as engineering support.
When I had to document how to get data in from Rust applications, I faced an unusually tough challenge. How could I create a snippet for a language I was utterly unfamiliar with and for which we lack a Splunk distribution? The examples in the official OpenTelemetry repository didn't work out of the box.
The answer proved simpler than I expected. While there is no Splunk distribution of OpenTelemetry Rust yet, you can still use the official OpenTelemetry crates for Rust to send traces and spans to the OpenTelemetry Collector, and from there to Splunk Observability Cloud.
My steps were as follows:
- Install the Splunk Distribution of OpenTelemetry Collector.
- Configure your cargo.toml file with the required dependencies.
- Instrument your Rust code manually, including resource attributes.
- Build and run the application.
- Search for your traces in Observability Cloud.
1. Install the Splunk Distribution of OpenTelemetry Collector
First, I needed a way of collecting and forwarding trace data to Splunk Observability Cloud. The Splunk Distribution of OpenTelemetry Collector does just that (among other things), as it includes defaults tailored to Splunk’s ingest endpoints. See Install the Collector in our docs for more information.
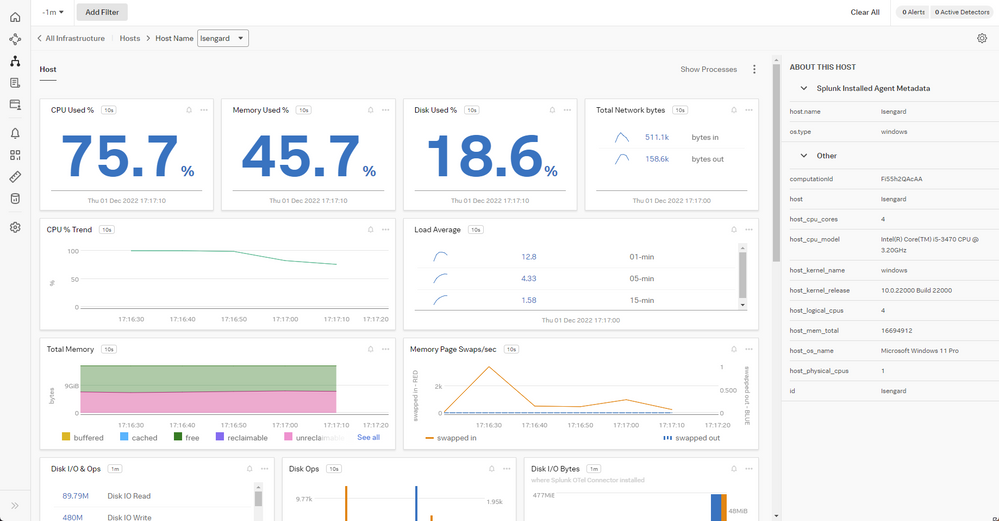
Once the Collector was up and running, I got lots of interesting metrics for my Windows box in Infrastructure Monitoring, like CPU and memory usage and which processes were running:
2. Define the dependencies
Finding the right dependencies took a while. I ended up comparing several examples from upstream repositories to get the right combination of requirements that matched Splunk's requirements.
As the OpenTelemetry Collector uses the OTLP format by default, opentelemetry-otlp was a must, as well as opentelemetry-proto to generate protobuf payloads. The extremely popular tokio crate handled networking (thanks to one of our resident Rustaceans, Nia Maxwell, for finding that out).
This is the cargo.toml file I ended up using:
[package]
name = "demorust"
version = "0.1.0"
edition = "2021"

[dependencies]
opentelemetry = { version = "0.18.0", features = ["rt-tokio", "metrics", "trace"] }
opentelemetry-otlp = { version = "0.11.0", features = ["trace", "metrics"] }
opentelemetry-semantic-conventions = { version = "0.10.0" }
opentelemetry-proto = { version = "0.1.0"}
tokio = { version = "1", features = ["full"] }
In my case I had to install protoc in my system before doing a cargo build:
# macOS (Homebrew)
brew install protobuf

# Windows (Chocolatey)
choco install protoc

# Ubuntu Linux
apt install protobuf-compiler
3. Instrument Your Rust Code
Next was instrumenting a Rust app. By reading the available examples in the OpenTelemetry repositories, I more or less understood which parts of the code were doing what and conjured some Frankencode. I also knew how other languages were dealing with manual instrumentation, so the steps looked familiar.
First I declared the modules. I reduced the use statements in my main.rs file to the ones strictly necessary by a process of elimination, that is, by trying to compile to the application after removing them. Not the most elegant way, I'm sure, but I was in a hurry. This ended up working:
use opentelemetry::global::shutdown_tracer_provider;
use opentelemetry::sdk::Resource;
use opentelemetry::trace::TraceError;
use opentelemetry::{global, sdk::trace as sdktrace};
use opentelemetry::{
    trace::{TraceContextExt, Tracer},
    Context, Key, KeyValue,
};
use opentelemetry_otlp::WithExportConfig;
use std::error::Error;
Then I defined a function to initialize the OpenTelemetry tracer. The code creates a new tracing pipeline that sends telemetry to the default OpenTelemetry Collector endpoint. Notice that the endpoint is the default URL for the local Collector. Theoretically, you’d send traces directly to Splunk’s ingest endpoints bypassing the Collector, though that would require adding headers for SPLUNK_REALM and SPLUNK_ACCESS_TOKEN.
fn init_tracer() -> Result<sdktrace::Tracer, TraceError> {
    opentelemetry_otlp::new_pipeline()
        .tracing()
        .with_exporter(
            opentelemetry_otlp::new_exporter()
                .tonic()
                .with_endpoint("http://localhost:4317"),
        )
        .with_trace_config(
            sdktrace::config().with_resource(Resource::new(vec![
              KeyValue::new(opentelemetry_semantic_conventions::resource::SERVICE_NAME,"trace-demo",),
              KeyValue::new(opentelemetry_semantic_conventions::resource::DEPLOYMENT_ENVIRONMENT,"production-rust",)
            ])),
         )
         .install_batch(opentelemetry::runtime::Tokio)
}
As for the trace configuration, I added two global resource attributes following OTel semantic conventions, SERVICE_NAME and DEPLOYMENT_ENVIRONMENT. This is a must, as it helps finding telemetry in Splunk Observability Cloud at a later stage.
Where was I? Ah, yes, instrumenting the application.
My Frankencode borrowed heavily from the OpenTelemetry example for OTLP here, with few modifications. Essentially, you define keys which you then feed to the tracer. I like citrus fruits, so I preserved the lemons from the example. Because why not?
const LEMONS_KEY: Key = Key::from_static_str("lemons");
const ANOTHER_KEY: Key = Key::from_static_str("ex.com/another");
Some tokyo magic ensues. Inside the async main() function — I'm not actually sure it had to be async, but rolled with it — we create a tracer and a context, as well as a couple of spans. Lastly, we shut down the tracer and end the program. End of the line.
#[tokio::main]
async fn main() -> Result<(), Box<dyn Error + Send + Sync + 'static>> {
    let _ = init_tracer()?;
    let _cx = Context::new();

    let tracer = global::tracer("ex.com/basic");

    tracer.in_span("operation", |cx| {
        let span = cx.span();
        span.add_event(
            "Nice operation!".to_string(),
            vec![Key::new("bogons").i64(100)],
        );
        span.set_attribute(ANOTHER_KEY.string("yes"));

        tracer.in_span("Sub operation...", |cx| {
            let span = cx.span();
            span.set_attribute(LEMONS_KEY.string("five"));
            span.add_event("Sub span event", vec![]);
        });
    });

    shutdown_tracer_provider();

    Ok(())

}
4. Build and run the Application
The last step is building and executing the instrumented application. For someone used to interpreting languages, the compilation process seemed slow and strange to me, but also helpful for identifying bugs in the code. Rust compiler's error messages were clear to understand.
With a shiny new executable inside the target directory, I immediately proceeded to run it several times, poking the Collector with test spans. The original example didn't output anything to the console, so I added a small line that sent a reassuring, if useless, message.
5. Search for Your Traces in Observability Cloud
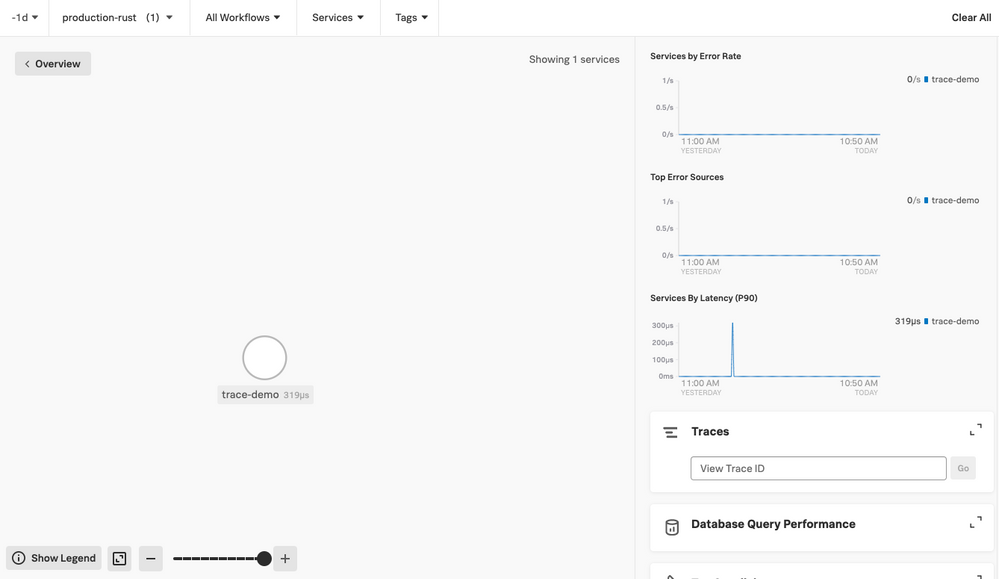
I waited some minutes, then opened APM in Observability Cloud. I filtered by the deployment environment of the demo application and saw my demo application and its data as a small dot in the service map.
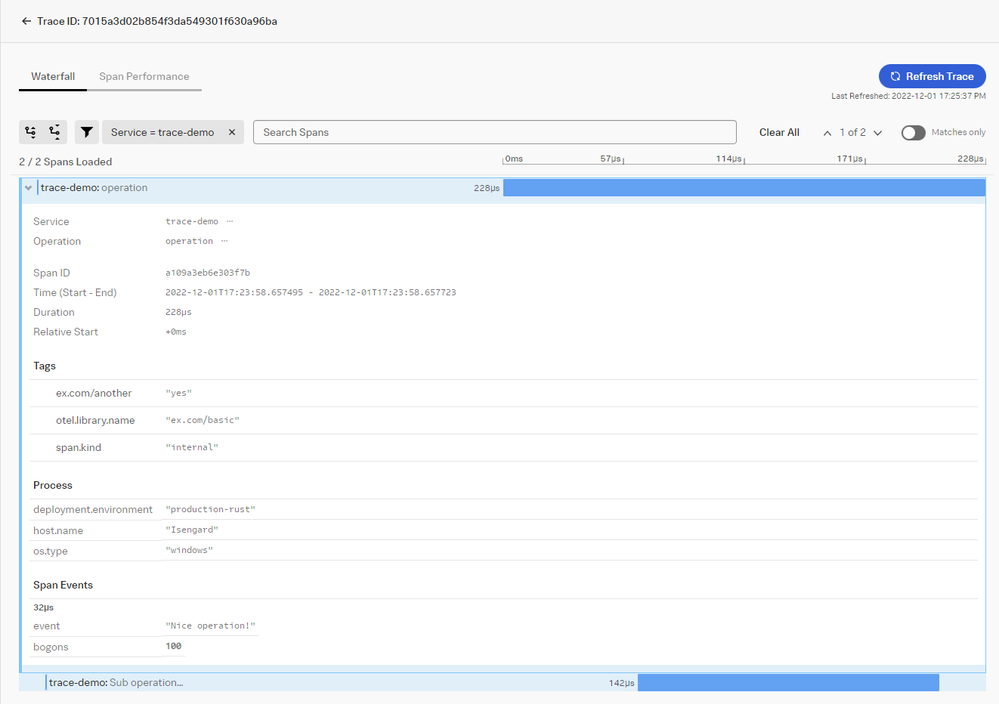
Another click and all the available traces appeared. Each span contained the sample attributes—hooray!
Voilá! I successfully instrumented a Rust application for Splunk Observability Cloud using OpenTelemetry, without prior knowledge of Rust except for a few bits of information. Quite the adventure!
— Fabrizio Ferri Benedetti, Senior Staff Technical Writer at Splunk
You must be a registered user to add a comment. If you've already registered, sign in. Otherwise, register and sign in.
Index This | What travels the world but is also stuck in place?
Discover New Use Cases: Unlock Greater Value from Your Existing Splunk Data
Continue Your Journey: Join Session 2 of the Data Management and Federation Bootcamp ...
-
.conf25
31 -
AI
35 -
App Dev
39 -
Career Report
9 -
Cisco Live
7 -
Cloud Platform
56 -
Community
79 -
Community Spotlight
21 -
Developer Spotlight
9 -
Enterprise
50 -
MVP
7 -
Observability
124 -
Office Hours
34 -
OpenTelemetry
53 -
Product Announcements
13 -
Security
68 -
Splunk Lantern
64 -
Splunk Love
7 -
SplunkTrust
33 -
Tech Talks
23 -
User Groups
9


