
Join the Conversation
- Find Answers
- :
- Apps & Add-ons
- :
- All Apps and Add-ons
- :
- All Apps and Add-ons
- :
- Using Status Indicator visualization to change col...
- Subscribe to RSS Feed
- Mark Topic as New
- Mark Topic as Read
- Float this Topic for Current User
- Bookmark Topic
- Subscribe to Topic
- Mute Topic
- Printer Friendly Page
- Mark as New
- Bookmark Message
- Subscribe to Message
- Mute Message
- Subscribe to RSS Feed
- Permalink
- Report Inappropriate Content
Using Status Indicator visualization to change color based on count

I am trying to use the Status Indicator visualization but I am unsure about the syntax. I have a search query that looks like this:
server="SERVER-1"
  | eval server="SERVER-1"
  | stats count
  | eval color=if(count<=0, "#dc4e41", "#65a637"), icon=if(count<=0, "times-circle", "check-circle")
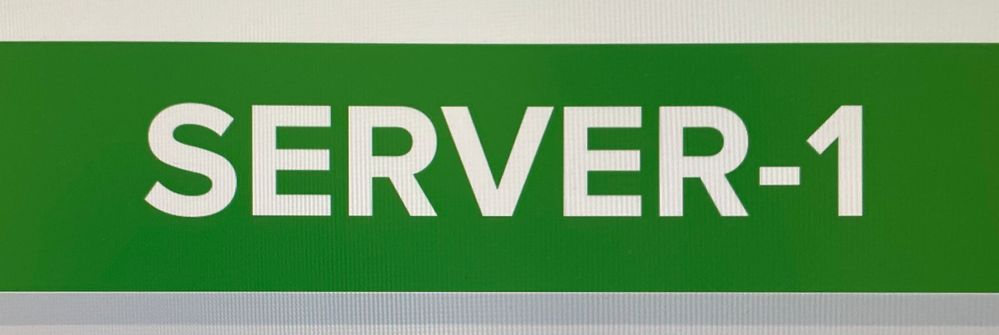
The panel should show the server name (SERVER-1) while the background color and icon changes according to count (if count<=0 the background should be red, otherwise the background should be green). Same idea for icons "times-circle" and "check-circle".
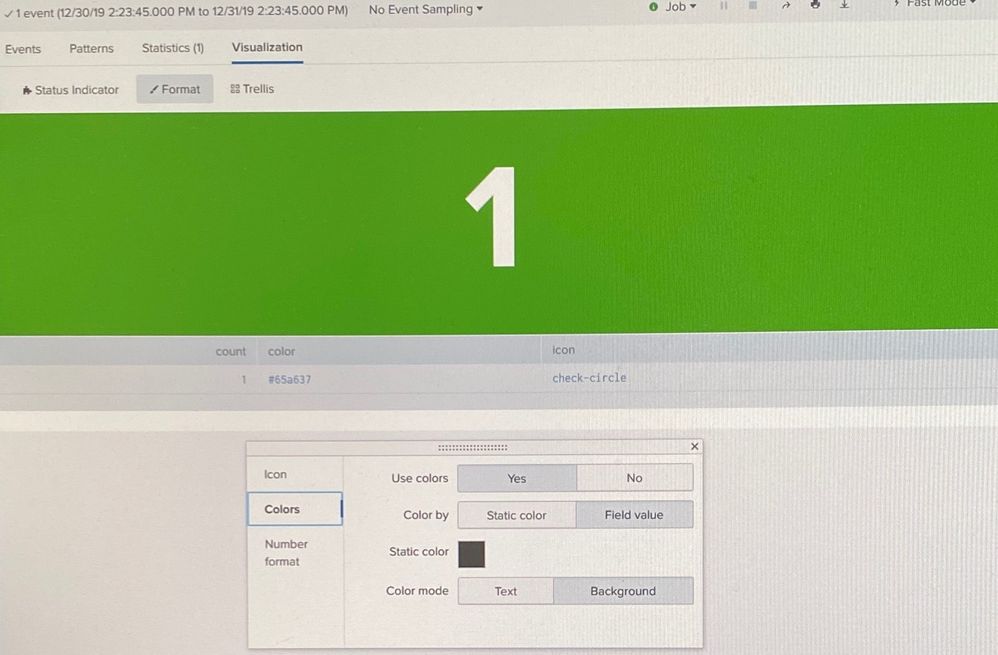
The first picture is what I have. The second picture is similar to what I want it to look like (it should also show an icon). Is there something wrong with my syntax? I don't want the count to be displayed, just the server name. I need the background color and icon to change based on count.
WHAT I HAVE:
WHAT I WANT IT TO LOOK LIKE:
- Mark as New
- Bookmark Message
- Subscribe to Message
- Mute Message
- Subscribe to RSS Feed
- Permalink
- Report Inappropriate Content

<form>
  <row>
    <panel>
      <table>
        <search id="bStats">
          <done>
            <condition>
              <set token="value3">$result.server$</set>
              <set token="color3">$result.color$</set>
              <set token="icon3">$result.icon$</set>
            </condition>
          </done>
          <query>| makeresults
| eval server="SERVER-1"
| stats count by server
| eval color=if(count<=0, "#dc4e41", "#65a637"), icon=if(count<=0, "times-circle", "check-circle")
| table server icon color</query>
          <earliest>-24h@h</earliest>
          <latest>now</latest>
          <sampleRatio>1</sampleRatio>
        </search>
        <option name="count">20</option>
        <option name="dataOverlayMode">none</option>
        <option name="drilldown">none</option>
        <option name="percentagesRow">false</option>
        <option name="refresh.display">progressbar</option>
        <option name="rowNumbers">false</option>
        <option name="totalsRow">false</option>
        <option name="wrap">true</option>
      </table>
    </panel>
    <panel>
      <viz type="status_indicator_app.status_indicator">
        <search base="bStats">
          <query/>
        </search>
        <option name="height">115</option>
        <option name="drilldown">none</option>
        <option name="refresh.display">progressbar</option>
        <option name="status_indicator_app.status_indicator.colorBy">field_value</option>
        <option name="status_indicator_app.status_indicator.fillTarget">background</option>
        <option name="status_indicator_app.status_indicator.fixIcon">warning</option>
        <option name="status_indicator_app.status_indicator.icon">field_value</option>
        <option name="status_indicator_app.status_indicator.precision">0</option>
        <option name="status_indicator_app.status_indicator.showOption">1</option>
        <option name="status_indicator_app.status_indicator.staticColor">#555</option>
        <option name="status_indicator_app.status_indicator.useColors">true</option>
        <option name="status_indicator_app.status_indicator.useThousandSeparator">false</option>
      </viz>
    </panel>
  </row>
</form>
Hi, @brandonbachman
Simple xml : I want to create cool single value display html
Please refer to the answer I asked earlier.




Join the Splunk Community Slack to learn, troubleshoot, and make connections with fellow Splunk practitioners in real time!
Join Splunk User Groups to connect and learn in-person by region or remotely by topic or industry.
Meet Splunk Observability Studio: AI-Assisted OpenTelemetry Instrumentation Without ...
Federated Search for Cisco Security and Analytics Logging (SAL) is now GA on Splunk ...
Your Path to AgenticOps: AI Experiences for Every Splunk Practitioner
