
Turn on suggestions
Auto-suggest helps you quickly narrow down your search results by suggesting possible matches as you type.
All Apps and Add-ons
×
Join the Conversation
Without signing in, you're just watching from the sidelines. Sign in or Register to connect, share, and be part of the Splunk Community.
- Find Answers
- :
- Apps & Add-ons
- :
- All Apps and Add-ons
- :
- All Apps and Add-ons
- :
- Re: Status Indicator Visualization not visualizing...
Options
- Subscribe to RSS Feed
- Mark Topic as New
- Mark Topic as Read
- Float this Topic for Current User
- Bookmark Topic
- Subscribe to Topic
- Mute Topic
- Printer Friendly Page
- Mark as New
- Bookmark Message
- Subscribe to Message
- Mute Message
- Subscribe to RSS Feed
- Permalink
- Report Inappropriate Content
Status Indicator Visualization not visualizing properly

brandonbachman
Engager
01-03-2020
07:00 PM
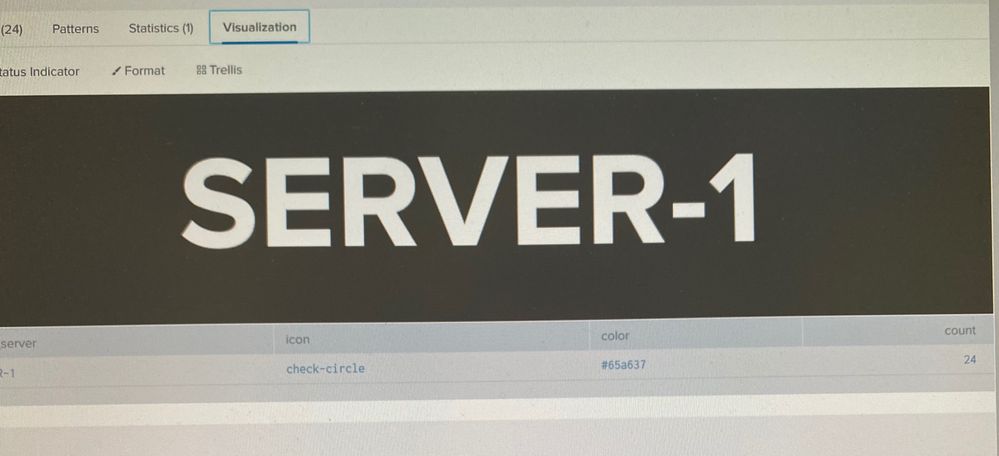
I am trying to use the Status Indicator Visualization to create a panel that lists a server name and changes background color based on count. The panel background should be green and there should be the check mark icon if count>0. If count<=0, the background should be red and the icon should be the circular x.
<row>
    <panel>
        <viz type="status_indicator_app.status_indicator">
            <search>
                <query>host="HOST-1"
                    | eval server="SERVER-1"
                    | stats count by server
                    | eval color=if(count<=0, "#dc4e41", "#65a637"),icon=if(count<=0, "times-circle", "check-circle")
                     | table server icon color</query>
               <earliest>-24h@h</earliest>
               <latest>now</latest>
            </search>
            <option name="drilldown">none</option>
            <option name="refresh.display">progressbar</option>
            <option name="status_indicator_app.status_indicator.colorBy">field_value</option>
            <option name="status_indicator_app.status_indicator.fillTarget">background</option>
            <option name="status_indicator_app.status_indicator.fixIcon">warning</option>
            <option name="status_indicator_app.status_indicator.icon">field_value</option>
            <option name="status_indicator_app.status_indicator.precision">0</option>
            <option name="status_indicator_app.status_indicator.showOption">3</option>
            <option name="status_indicator_app.status_indicator.staticColor">#555</option>
            <option name="status_indicator_app.status_indicator.useColors">true</option>
            <option name="status_indicator_app.status_indicator.useThousandSeparator">false</option>
        </viz>
    </panel>
</row>
With this code I am able to see the proper values for icon, color, and count in the table, but the visualization isn't showing properly (the background isn't changing color and there are no icons). Is there something wrong with my syntax?
- Mark as New
- Bookmark Message
- Subscribe to Message
- Mute Message
- Subscribe to RSS Feed
- Permalink
- Report Inappropriate Content

mydog8it
Builder
01-03-2020
08:11 PM
The "greater than" and "less than" signs must be encoded differently. Try using < in place of "less than" and > in place of "greater than"
 <row>
     <panel>
         <viz type="status_indicator_app.status_indicator">
             <search>
                 <query>host="HOST-1"
                     | eval server="SERVER-1"
                     | stats count by server
                     | eval color=if(count<=0, "#dc4e41", "#65a637"),icon=if(count<=0, "times-circle", "check-circle")
                      | table server icon color</query>
                <earliest>-24h@h</earliest>
                <latest>now</latest>
             </search>
             <option name="drilldown">none</option>
             <option name="refresh.display">progressbar</option>
             <option name="status_indicator_app.status_indicator.colorBy">field_value</option>
             <option name="status_indicator_app.status_indicator.fillTarget">background</option>
             <option name="status_indicator_app.status_indicator.fixIcon">warning</option>
             <option name="status_indicator_app.status_indicator.icon">field_value</option>
             <option name="status_indicator_app.status_indicator.precision">0</option>
             <option name="status_indicator_app.status_indicator.showOption">3</option>
             <option name="status_indicator_app.status_indicator.staticColor">#555</option>
             <option name="status_indicator_app.status_indicator.useColors">true</option>
             <option name="status_indicator_app.status_indicator.useThousandSeparator">false</option>
         </viz>
     </panel>
 </row>



Got questions? Get answers!
Join the Splunk Community Slack to learn, troubleshoot, and make connections with fellow Splunk practitioners in real time!
Meet up IRL or virtually!
Join Splunk User Groups to connect and learn in-person by region or remotely by topic or industry.
Get Updates on the Splunk Community!
Cisco Data Fabric from Architecture to Investigation, Better SOC Visibility, and More ...
Splunk Lantern is Splunk’s customer success center that provides practical guidance from Splunk experts on key ...
The Trust Gap: Why a Data Foundation is Fundamental to an Agentic Enterprise
The Trust Gap: Why a data foundation is fundamental to an Agentic Enterprise.
Agentic AI is transforming ...
Data Management Digest – September 2026
Welcome to the September 2026 edition of Data Management Digest!
September brought a fresh wave of ...
