Join the Conversation
- Find Answers
- :
- Apps & Add-ons
- :
- All Apps and Add-ons
- :
- All Apps and Add-ons
- :
- Re: Splunk Connect for Kubernetes is parsing json ...
- Subscribe to RSS Feed
- Mark Topic as New
- Mark Topic as Read
- Float this Topic for Current User
- Bookmark Topic
- Subscribe to Topic
- Mute Topic
- Printer Friendly Page
- Mark as New
- Bookmark Message
- Subscribe to Message
- Mute Message
- Subscribe to RSS Feed
- Permalink
- Report Inappropriate Content
Splunk Connect for Kubernetes is parsing json string values as individual events
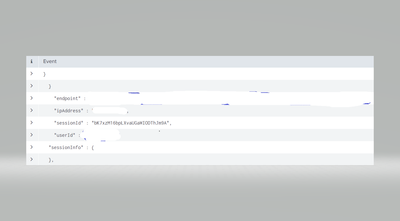
We have applications running on OpenShift platform (v 3.11) and logs are written to STDOUT. We have setup Splunk Connect for Kubernetes to forward logs from OpenShift to Splunk instance. Setup is working and we are able to see and search logs in Splunk but the issue we are facing is that all lines in Application logs are displayed as individual events in Splunk search, for example if there is some json string in logs then each value in json output is displayed as individual events as shown in below screenshot.
Here is the raw log:
"sessionInfo" : {
"userId" : "",
"sessionId" : "bK7xzM16bpLXvaUGaWIODThJm9A",
"ipAddress" : "",
"endpoint" : ""
}
}
I suspect some intermediary component between Openshift and splunk is doing this wrapping which might be throwing off the parser, that's my take but I'm not entirely sure about how Splunk Connect for Kubernetes is handling this. Any help/suggestions in fixing is greatly appreciated.
Thanks in advance!
Note: Similar app logs which are forwarded to Splunk instance using universal forwarder from linux machine are displayed in correct format in Splunk search.
- Mark as New
- Bookmark Message
- Subscribe to Message
- Mute Message
- Subscribe to RSS Feed
- Permalink
- Report Inappropriate Content
Hi,
This sounds like a typical multiline issue. Check crio logs on the worker node where your application pods are running. If the displayed json is line by line - what i would guess - then you will need to setup multiline support in fluentd.. https://github.com/splunk/splunk-connect-for-kubernetes/blob/8ba455e7f988d129c9bfa13fdcf2025c6c4ae72...
.. meaning you need to concat the event to fluentd before sending it to hec.
Another technical working solution is to fix the events in splunk on hec side. When your sourcetype for the damaged application is brokensourcetype set at SCK you can rename it, write it to aggQueue and so fix it with splunk props.conf capabilities.
props.conf
[brokensourcetype]
TRANSFORMS-streams =renamest,write-agg
[jsonfixed]
... fix your json here
transforms.conf:
[write-agg]
REGEX = .*
DEST_KEY=queue
FORMAT=aggQueue

[renamest]
REGEX = .*
FORMAT = sourcetype::jsonfixed
DEST_KEY = MetaData:Sourcetype
Regards,
Andreas
- Mark as New
- Bookmark Message
- Subscribe to Message
- Mute Message
- Subscribe to RSS Feed
- Permalink
- Report Inappropriate Content
I tried adding multiline as below (since our json output starts with "{")
multiline:
        firstline: /^{/
        flushInterval: 1
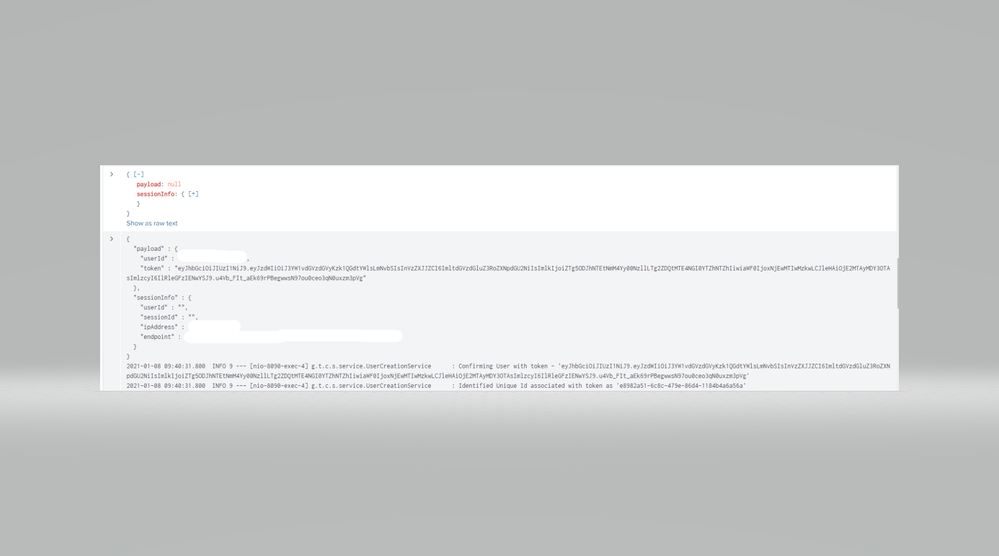
Now we can see json output parsing correctly as single event in some occurrences and in some cases, there are additional lines included in the same event (see below example).
Is there an option to include something like last/end line parameter to multiline options? or any other way to fix this.
Appreciate your help/suggestion regarding this issue.
- Mark as New
- Bookmark Message
- Subscribe to Message
- Mute Message
- Subscribe to RSS Feed
- Permalink
- Report Inappropriate Content
Fluentd concat filter has many settings that should help you here...
https://github.com/fluent-plugins-nursery/fluent-plugin-concat#parameter
Any luck with your logs yet?
- Mark as New
- Bookmark Message
- Subscribe to Message
- Mute Message
- Subscribe to RSS Feed
- Permalink
- Report Inappropriate Content
In container logs on worker node, json is line by line and also "/n" is included for each line
{"log":"{\n","stream":"stdout","time":"2021-01-07T23:37:54.053738972Z"}
{"log":"  \"payload\" : \"\",\n","stream":"stdout","time":"2021-01-07T23:37:54.053746532Z"}
{"log":"  \"sessionInfo\" : {\n","stream":"stdout","time":"2021-01-07T23:37:54.053751058Z"}
{"log":"    \"userId\" : \"\",\n","stream":"stdout","time":"2021-01-07T23:37:54.053755004Z"}
{"log":"    \"sessionId\" : \"WT-3bF-VK35ZlXvqvUzT3kdkRsc\",\n","stream":"stdout","time":"2021-01-07T23:37:54.053759095Z"}
{"log":"    \"ipAddress\" : \"\",\n","stream":"stdout","time":"2021-01-07T23:37:54.053763148Z"}
{"log":"    \"endpoint\" : \""\n","stream":"stdout","time":"2021-01-07T23:37:54.053767198Z"}
{"log":"  }\n","stream":"stdout","time":"2021-01-07T23:37:54.053771398Z"}
{"log":"}\n","stream":"stdout","time":"2021-01-07T23:37:54.053780998Z"}

