- Mark as New
- Bookmark Message
- Subscribe to Message
- Mute Message
- Subscribe to RSS Feed
- Permalink
- Report Inappropriate Content
I've just started messing around with Splunk to see if it would be good to use in our environment. I installed the *Nix App on my test machine, which is running Ubuntu 10.04 LTS. After accessing the app I notice that some of the "fields" aren't populating. For example, the CPU Overview has 4 boxes: consumption by command, consumption by user, cpu load by host, 5 most popular executables. The CPU Load By Host box has a graph, so it's getting data. The other 2 show the message: No results found. Inspect ...". I click the Inspect link but I'm not entirely sure what I'm looking for. Here's what I see
(bolded text is what is highlighted):
search index="os" sourcetype="ps" host="*" | multikv fields pctCPU, COMMAND | stats sum(pctCPU) as pctCPU by _time,COMMAND | timechart avg(pctCPU) by COMMAND
This search is an instance of the saved search: CPU Usage by Command (UNIX - CPU).
The following messages were returned by the search subsystem:
DEBUG: base lispy: [ AND host::* index::os sourcetype::ps ]
DEBUG: search context: user="admin", app="unix", bs-pathname="/home/myusername/splunk/etc"
I read the contents of http://docs.splunk.com/Documentation/Splunk/latest/Admin/Cantfindthedatayourelookingfor and notice it says that the free version doesn't allow you to use "scheduled saved searches or summary indexing". Is that what's happening here?
Edited to add: using Splunk version 4.3 and Splunk for *Nix version 4.5
- Mark as New
- Bookmark Message
- Subscribe to Message
- Mute Message
- Subscribe to RSS Feed
- Permalink
- Report Inappropriate Content
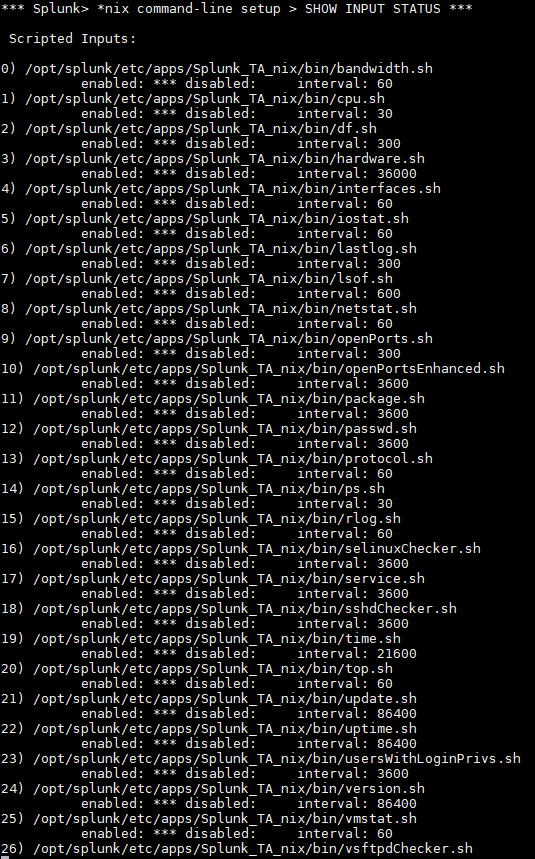
Splunk for Unix and Linux uses scripted inputs to populate its dashboards - in the case above, unix/bin/ps.sh. Thus, if you have not enabled the proper scripted inputs, either in Splunk Mangager of via the app's setup page, the dashboards will not be populated with data.
- Mark as New
- Bookmark Message
- Subscribe to Message
- Mute Message
- Subscribe to RSS Feed
- Permalink
- Report Inappropriate Content
I have all enabled but I have no data in the different dashboard
Can you help me ?
- Mark as New
- Bookmark Message
- Subscribe to Message
- Mute Message
- Subscribe to RSS Feed
- Permalink
- Report Inappropriate Content
@DamienLeveque, you've added on to a thread that is six years old and has an accepted answer. Please post a new question for help with your problem.
If this reply helps you, Karma would be appreciated.
- Mark as New
- Bookmark Message
- Subscribe to Message
- Mute Message
- Subscribe to RSS Feed
- Permalink
- Report Inappropriate Content
Splunk for Unix and Linux uses scripted inputs to populate its dashboards - in the case above, unix/bin/ps.sh. Thus, if you have not enabled the proper scripted inputs, either in Splunk Mangager of via the app's setup page, the dashboards will not be populated with data.
- Mark as New
- Bookmark Message
- Subscribe to Message
- Mute Message
- Subscribe to RSS Feed
- Permalink
- Report Inappropriate Content
no problem, glad to help!
- Mark as New
- Bookmark Message
- Subscribe to Message
- Mute Message
- Subscribe to RSS Feed
- Permalink
- Report Inappropriate Content
Oh, thanks. I didn't get that some of the "scripted Input" options were dependent upon each other. For example, I had enabled cpu.sh but not ps.sh because I didn't think I needed it. I went in and enabled all the scripts to be on the safe side and the various fields/panes are now populated. Thank you for your help.

