- Mark as New
- Bookmark Message
- Subscribe to Message
- Mute Message
- Subscribe to RSS Feed
- Permalink
- Report Inappropriate Content
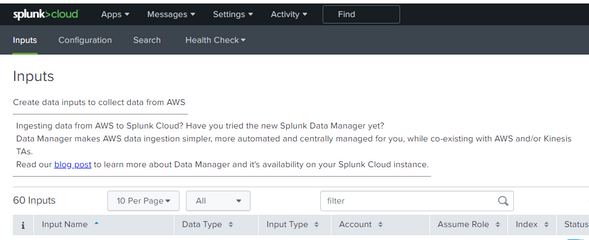
Noob question, can someone pls assist how to get alert when any of the inputs under any TA (Add-on) stops sending logs for last 24 h ? Lets take Splunk Add-on for AWS as an example. I have around 60 inputs configured. How do i write a search that can alert when either of these 60 inputs stop working ? if i do a "index=aws" , it shows me various sources and sourcetypes but there isn't any field that has names of these Inputs .
We have run into issues that we had to manually enable/disable inputs quite frequently when they stop logging.
- Mark as New
- Bookmark Message
- Subscribe to Message
- Mute Message
- Subscribe to RSS Feed
- Permalink
- Report Inappropriate Content
Hi @neerajs_81 ...
if i do a "index=aws" , it shows me various sources and sourcetypes but there isn't any field that has names of these Inputs.
The "name of the monitor" is simply a basic property of a log source. we should not use the name of the monitor to identify a log events.
As a new splunk user, i can understand your view, but, splunk provides more clear methods to solve your issue.
As you said, "if i do a "index=aws" , it shows me various sources and sourcetypes".. you should find out which source and sourcetype you are looking for the alerting.
Actually On production systems we will need to use many fields to filter out the log events... for example , the sourcetypes...aws:billing, aws:s3.. and then, we may need to use other fields and create the alert.
On the Splunk_TA_aws, you can select the 4th tab "Health Check", the drop down will list.. Health Overview and S3 Inputs Health Details.. when you select "S3 Inputs Health Details".. it will show you a big dashboard with multiple panels.. the first dashboard panel "SQS-Based S3 Time Lapse between Log Creation and Indexing".. you can click on the "Open in Search".. which will open a search window with the search query pre-loaded ..
index="_internal" (datainput="*")(host="*") sourcetype="aws:sqsbaseds3:log" (message="Sent data for indexing.")
| eval delay=_time-strptime(last_modified, "%Y-%m-%dT%H:%M:%S%Z")
| eval delay = if (delay<0,0,delay)
| timechart eval(round(mean(delay),3)) by datainput
you can save this as an alert.. so, now you can see that we got many fields like.. index, datainput, host, sourcetype, message.. with these fields, we can pin point the log events and create the alert. hope you got it.. let us know if need more details.. thanks.
Sekar
PS - If this or any post helped you in any way, pls consider upvoting, thanks for reading !
- Mark as New
- Bookmark Message
- Subscribe to Message
- Mute Message
- Subscribe to RSS Feed
- Permalink
- Report Inappropriate Content
Wonderful thank you for the details. I can use your index=_internal query for any log source actually.
- Mark as New
- Bookmark Message
- Subscribe to Message
- Mute Message
- Subscribe to RSS Feed
- Permalink
- Report Inappropriate Content
Hi @neerajs_81 ...
if i do a "index=aws" , it shows me various sources and sourcetypes but there isn't any field that has names of these Inputs.
The "name of the monitor" is simply a basic property of a log source. we should not use the name of the monitor to identify a log events.
As a new splunk user, i can understand your view, but, splunk provides more clear methods to solve your issue.
As you said, "if i do a "index=aws" , it shows me various sources and sourcetypes".. you should find out which source and sourcetype you are looking for the alerting.
Actually On production systems we will need to use many fields to filter out the log events... for example , the sourcetypes...aws:billing, aws:s3.. and then, we may need to use other fields and create the alert.
On the Splunk_TA_aws, you can select the 4th tab "Health Check", the drop down will list.. Health Overview and S3 Inputs Health Details.. when you select "S3 Inputs Health Details".. it will show you a big dashboard with multiple panels.. the first dashboard panel "SQS-Based S3 Time Lapse between Log Creation and Indexing".. you can click on the "Open in Search".. which will open a search window with the search query pre-loaded ..
index="_internal" (datainput="*")(host="*") sourcetype="aws:sqsbaseds3:log" (message="Sent data for indexing.")
| eval delay=_time-strptime(last_modified, "%Y-%m-%dT%H:%M:%S%Z")
| eval delay = if (delay<0,0,delay)
| timechart eval(round(mean(delay),3)) by datainput
you can save this as an alert.. so, now you can see that we got many fields like.. index, datainput, host, sourcetype, message.. with these fields, we can pin point the log events and create the alert. hope you got it.. let us know if need more details.. thanks.
Sekar
PS - If this or any post helped you in any way, pls consider upvoting, thanks for reading !

