Join the Conversation
- Find Answers
- :
- Using Splunk
- :
- Other Using Splunk
- :
- Alerting
- :
- Re: Alerts not triggering
- Subscribe to RSS Feed
- Mark Topic as New
- Mark Topic as Read
- Float this Topic for Current User
- Bookmark Topic
- Subscribe to Topic
- Mute Topic
- Printer Friendly Page
- Mark as New
- Bookmark Message
- Subscribe to Message
- Mute Message
- Subscribe to RSS Feed
- Permalink
- Report Inappropriate Content
Alerts not triggering
Good morning,
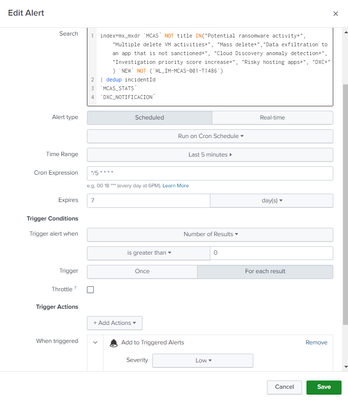
I have some alerts that I have set up that are not triggering. They are Defender events. If I run the query in a normal search if I get the results of the alerts that I miss. However, for some reason the alerts are not triggered: neither the email is sent, nor do they appear in the Triggered alerts section.
This is my alert
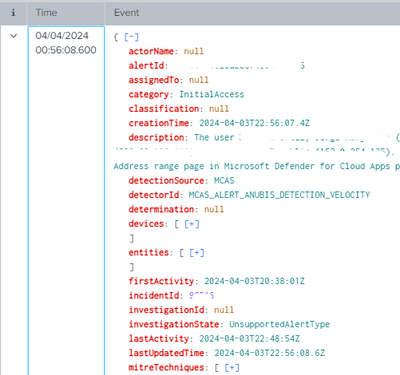
and this is one of the events for which it should have triggered and has not triggered:
I also tried disabling the throttle in case there was a problem and it was leaking.
I also checked to see if the search had been skipped but it was not.
Any idea?
- Mark as New
- Bookmark Message
- Subscribe to Message
- Mute Message
- Subscribe to RSS Feed
- Permalink
- Report Inappropriate Content
Have you checked splunk internal log for ERROR ?
- Mark as New
- Bookmark Message
- Subscribe to Message
- Mute Message
- Subscribe to RSS Feed
- Permalink
- Report Inappropriate Content
Yes, no error.
- Mark as New
- Bookmark Message
- Subscribe to Message
- Mute Message
- Subscribe to RSS Feed
- Permalink
- Report Inappropriate Content
Yes:
index=conf detectionSource=MCAS NOT title IN("Potential ransomware activity*", "Multiple delete VM activities*", "Mass delete*","Data exfiltration to an app that is not sanctioned*", "Cloud Discovery anomaly detection*", "Investigation priority score increase*", "Risky hosting apps*", "DXC*") status=new NOT ((title="Impossible travel activity" AND description="*Mexico*" AND description="*United States*"))
| dedup incidentId
| rename entities{}.* AS * devices{}.* AS * evidence{}.* AS *
| stats values(title) as AlertName, values(deviceDnsName) as Host, values(user) as "Account", values(description) as "Description", values(fileName) as file, values(ipAddress) as "Source IP", values(category) as "Mitre" by incidentId
| rename incidentId AS ID_Defender
| tojson auto(AlertName), auto(Host), auto("Account"), auto("Description"), auto(file), auto("Source IP"), auto("Mitre") output_field=events
| eval events=replace(events, "\\[\"", "\""), events=replace(events, "\"\\]", "\"")
| rex field=events mode=sed "s/:\\[([0-9])\\]/:\\1/g"
| eval native_alert_id = "SPL" . strftime(now(), "%Y%m%d%H%M%S") . "" . tostring(random())
| tojson auto(native_alert_id) output_field=security
| eval security=replace(security, "\\[\"", "\""), security=replace(security, "\"\\]", "\"")
| rename security AS "security-alert"
| tojson json(security-alert), auto(events) output_field=security-alert
| eval _time=now()
- Mark as New
- Bookmark Message
- Subscribe to Message
- Mute Message
- Subscribe to RSS Feed
- Permalink
- Report Inappropriate Content
Why are you resetting _time? This is masking what timestamp was used when the event was indexed. You should also look at _indextime to see if there is any significant delay between when the event was created i.e. the time in the data, and the time it was indexed because it could be that the event was indexed in the last 5 minutes but the timestamp is prior to that so wouldn't get picked up by the search.
- Mark as New
- Bookmark Message
- Subscribe to Message
- Mute Message
- Subscribe to RSS Feed
- Permalink
- Report Inappropriate Content
where can i see the index time?
- Mark as New
- Bookmark Message
- Subscribe to Message
- Mute Message
- Subscribe to RSS Feed
- Permalink
- Report Inappropriate Content
It is a system field called _indextime - you could rename it without the leading _ so it becomes visible. If you want to use it, you may need to include it in the stats command since this command only keeps fields which are explicitly named.
- Mark as New
- Bookmark Message
- Subscribe to Message
- Mute Message
- Subscribe to RSS Feed
- Permalink
- Report Inappropriate Content
Ok, thank you.
In one of the cases that I didn't get my alert triggered,
TimeIndexed = 2024-04-04 01:01:59
_time=04/04/2024 00:56:08.600
- Mark as New
- Bookmark Message
- Subscribe to Message
- Mute Message
- Subscribe to RSS Feed
- Permalink
- Report Inappropriate Content
OK so the next time period after it was indexed would be 2024-04-04 01:00 to 2024-04-04 01:04:59 which doesn't include 04/04/2024 00:56:08.600 which is why your alert didn't get triggered.
- Mark as New
- Bookmark Message
- Subscribe to Message
- Mute Message
- Subscribe to RSS Feed
- Permalink
- Report Inappropriate Content
and what could be a solution?
- Mark as New
- Bookmark Message
- Subscribe to Message
- Mute Message
- Subscribe to RSS Feed
- Permalink
- Report Inappropriate Content
Well, it now becomes a balancing act. Your particular event to a little over 5 minutes from the _time in the event to the time it was indexed, so you could gamble and change your alert so that every 5 minutes it looks back between 10 minutes ago and 5 minutes ago. That way you will probably get all the events for that time period, but the problem here is that they will be at least 5 minutes late and upto 10 minutes late.
Another option is to look back 10 minutes but your run the risk of double counting your alerts i.e. an event could fall into two searches. This may not be a problem for you - that is for you to decide.
An enhancement to this is to write the events which you have alerted on, to a summary index and check against the summary index to see if it is a new alert. If you do that, you could even afford to look back 15 minutes since you will have a deduping method in place.
- Mark as New
- Bookmark Message
- Subscribe to Message
- Mute Message
- Subscribe to RSS Feed
- Permalink
- Report Inappropriate Content
and what can be the problem when the difference is 4-5 min between the indexing time and the _time, and the alert runs every 15 min and looks at the last 15 min.
- Mark as New
- Bookmark Message
- Subscribe to Message
- Mute Message
- Subscribe to RSS Feed
- Permalink
- Report Inappropriate Content
If your report runs every 15 minutes looking back 15 minutes, there will be boundary conditions where the event has a timestamp in the 15 minutes prior to the reported one, which didn't get indexed until this time period and therefore is missed
- Mark as New
- Bookmark Message
- Subscribe to Message
- Mute Message
- Subscribe to RSS Feed
- Permalink
- Report Inappropriate Content
I will try to search in the last 60 min by doing a throttle of the incidentId
- Mark as New
- Bookmark Message
- Subscribe to Message
- Mute Message
- Subscribe to RSS Feed
- Permalink
- Report Inappropriate Content
As I explained earlier, you don't need to just look back further and further. The "issue" is to do with indexing lag. Whenever that lag spans a report time period boundary, you have the potential for missed events. To mitigate this, you could use overlapping time periods, and use some sort of deduplication scheme, such as a summary index, if you want to avoid multiple alerts for the same event.
- Mark as New
- Bookmark Message
- Subscribe to Message
- Mute Message
- Subscribe to RSS Feed
- Permalink
- Report Inappropriate Content
Could you explain to me what you mean by overlapping times?
- Mark as New
- Bookmark Message
- Subscribe to Message
- Mute Message
- Subscribe to RSS Feed
- Permalink
- Report Inappropriate Content
For example, one report runs at 10 minutes past the hour, looking back 10 minutes. The next time the report runs is 15 minutes past the hour, again looking back 10 minutes. Between these two runs, there is a five minute overlap between 5 past and 10 past the hour. If you don't take account of this, you could be double counting your events.
- Mark as New
- Bookmark Message
- Subscribe to Message
- Mute Message
- Subscribe to RSS Feed
- Permalink
- Report Inappropriate Content
I am not going to experience this problem because I apply a throttle per event ID, and in some cases a dedup of the ID in the query itself, and I have set the alert to look 30 min back and run every ten but I still lose some events that do appear if I run the search.
- Mark as New
- Bookmark Message
- Subscribe to Message
- Mute Message
- Subscribe to RSS Feed
- Permalink
- Report Inappropriate Content
You are not giving much away! You will need to do some digging! Which events are not being picked up? When do they occur and when do they get indexed? How do these times relate to your alert searches? How important are these missed alerts? How much effort do you want to spend finding these events?
- Mark as New
- Bookmark Message
- Subscribe to Message
- Mute Message
- Subscribe to RSS Feed
- Permalink
- Report Inappropriate Content
Oh, I have put a lot of information about it like the example I gave. I have put the search query, an example of an event, the alert configuration, etc. They are events ingested by the Microsoft security API, coming from the Defender, and the queries are basic, if the title of the events is x, it is triggered. It is already desperation, because if you run the search normally, it detects the event it should but the alert has not been generated. So the only option I can think of is the indexing time, but I understand that if the search runs every 5 minutes and searches the entire previous hour, there should be no problem and there still is.
These alerts are very important to me, and they must appear no matter what.
In the example I mentioned at the beginning:
TimeIndexed = 2024-04-04 01:01:59
_time=04/04/2024 00:56:08.600
- Mark as New
- Bookmark Message
- Subscribe to Message
- Mute Message
- Subscribe to RSS Feed
- Permalink
- Report Inappropriate Content
Sounds like you are doing everything right, having said that, I don't use throttling by incident id, so perhaps there is an issue there? Are the incident ids completely unique? Is there a pattern to the incidents which are getting missed?


