Are you a member of the Splunk Community?
- Find Answers
- :
- Using Splunk
- :
- Splunk Search
- :
- how to see pan and zoom selected in a chart when d...
- Subscribe to RSS Feed
- Mark Topic as New
- Mark Topic as Read
- Float this Topic for Current User
- Bookmark Topic
- Subscribe to Topic
- Mute Topic
- Printer Friendly Page
- Mark as New
- Bookmark Message
- Subscribe to Message
- Mute Message
- Subscribe to RSS Feed
- Permalink
- Report Inappropriate Content
how to see pan and zoom selected in a chart when dashboard is copied
Hi,
i want to send a dashboard link to someone, after selecting a zoom/pan in a chart and i want that pan to be copied so that the other person can see the same time range that i selected.
At this moment my token $selection$ goes right in the url but when the dashboard runs the token is set to the default value of the total time window. Any ideas how to resolve this??
Thanks in advance,
Hugo Monteiro
- Mark as New
- Bookmark Message
- Subscribe to Message
- Mute Message
- Subscribe to RSS Feed
- Permalink
- Report Inappropriate Content
[UPDATED ANSWER]
Providing reason and functioning of run anywhere example provided below. Also an alternate option to Code required selection drilldown behavior using Simple XML JavaScript Extension.
@monteiroh, right now you are using the URL of current dashboard to share with other users. What I am requesting is to drilldown first and then share the URL of the drilldown URL (which is the same as original dashboard but time range selected in the chart becomes the earliest and latest time). Have you tried the run anywhere example?
In order to understand the reason why it needs to be done this way, you need to understand the difference between form tokens and regular tokens. The tokens generated by inputs are form tokens and they persist as query string as part of dashboard URL. However, regular tokens created manually within the dashboard do not persist as URL. They will either unset or reset to initialization value (for example through <init> section in 6.5 onward or independent or other searches that run on dashboard load).
So if your goal is to have URL with updated time from the dashboard on the selection of chart, you would need to override the original time on <selection> event handler. I am doubtful though that this will work with Simple XML (you can try and confirm). You should check out the following answer and code your own JavaScript chart <selection> event handler to take such action: https://answers.splunk.com/answers/563661/drill-down-ganttbartimeline-chart-and-assign-speci.html
What I wanted to provide was a Simple XML Approach to share the correct URL with Selection Time so that the end user sees the events from the selected time timerange.
@monteiroh, You would need to create a <drilldown> on the second panel so that the Selected time is passed on the same dashboard opened in a new window.
<drilldown>
<link target="_blank">/app/<yourAppName>/<yourDashboard>?form.<yourTimeInputToken>.earliest=$selection.earliest$&form.<yourTimeInputToken>.latest=$selection.latest$</link>
</drilldown>
Where you would need to set <yourAppName>, <yourDashboard> and <yourTimeInputToken> as per what you have in your environment.
Following is a run anywhere example which uses search app, chart_selection dashboard and tokTime input.
<form>
<label>Chart Selection</label>
<!-- Dummy Search to Set Earliest Latest Epoch time based on Time Input Picker -->
<search>
<query>| makeresults
</query>
<earliest>$tokTime.earliest$</earliest>
<latest>$tokTime.latest$</latest>
<done>
<eval token="tokEarliest">strptime($job.earliestTime$,"%Y/%m/%d %H:%M:%S.3N %Z")</eval>
<eval token="tokLatest">strptime($job.latestTime$,"%Y/%m/%d %H:%M:%S.3N %Z")</eval>
<set token="tokEarliestString">$job.earliestTime$</set>
<set token="tokLatestString">$job.latestTime$</set>
</done>
</search>
<fieldset submitButton="false"></fieldset>
<row>
<panel>
<input type="time" token="tokTime" searchWhenChanged="true">
<label></label>
<default>
<earliest>-24h@h</earliest>
<latest>now</latest>
</default>
</input>
<chart>
<title>Use Pan and Zoom to Select Time Ranges Used By Other Visualizations</title>
<search>
<query>index=_internal sourcetype=splunkd* component=*
| timechart count by component usenull=f useother=f</query>
<earliest>$tokTime.earliest$</earliest>
<latest>$tokTime.latest$</latest>
</search>
<selection>
<set token="selection.earliest">$start$</set>
<set token="selection.latest">$end$</set>
<set token="start.count">$start.count$</set>
<set token="end.count">$end.count$</set>
</selection>
<option name="charting.axisTitleX.visibility">collapsed</option>
<option name="charting.axisTitleY.visibility">collapsed</option>
<option name="charting.axisTitleY2.visibility">visible</option>
<option name="charting.chart">line</option>
<option name="charting.legend.masterLegend">null</option>
<option name="charting.legend.placement">right</option>
<option name="height">200</option>
<option name="refresh.display">progressbar</option>
</chart>
</panel>
<panel>
<title>Log Levels - Info over Error Warn or Fatal - Timechart</title>
<chart>
<search>
<query>index=_internal sourcetype=splunkd_ui_access
| timechart count by sourcetype</query>
<earliest>$selection.earliest$</earliest>
<latest>$selection.latest$</latest>
</search>
<option name="charting.axisTitleX.visibility">collapsed</option>
<option name="charting.axisTitleY.visibility">collapsed</option>
<option name="charting.axisTitleY2.visibility">visible</option>
<option name="charting.axisY2.enabled">1</option>
<option name="charting.chart">column</option>
<option name="charting.chart.overlayFields">INFO</option>
<option name="charting.drilldown">all</option>
<option name="charting.legend.masterLegend">null</option>
<option name="charting.legend.placement">right</option>
<option name="height">200</option>
<option name="refresh.display">progressbar</option>
<drilldown>
<link target="_blank">/app/search/chart_selection?form.tokTime.earliest=$selection.earliest$&form.tokTime.latest=$selection.latest$</link>
</drilldown>
</chart>
</panel>
</row>
</form>
PS: target="_blank" opens the dashboard in a new window so that the URL for dashboard with timechart selection time can be shared.
Please try out and confirm!
| makeresults | eval message= "Happy Splunking!!!"
- Mark as New
- Bookmark Message
- Subscribe to Message
- Mute Message
- Subscribe to RSS Feed
- Permalink
- Report Inappropriate Content
ty for your answer but what i want is not a drilldown on another chart is just the same chart where i select the time range using pan and zoom and see the exact same thing when duplicate pages.
- Mark as New
- Bookmark Message
- Subscribe to Message
- Mute Message
- Subscribe to RSS Feed
- Permalink
- Report Inappropriate Content
@niketnilay i used form.selection.earliest and the value goes correctly in the url but when the dashboard runs it resets to full time window 😞
- Mark as New
- Bookmark Message
- Subscribe to Message
- Mute Message
- Subscribe to RSS Feed
- Permalink
- Report Inappropriate Content
I think rather than selection token.. it should be form.tokTime.earliest and form.tokTime.latest to be overridden with selection earliest and latest time. I have this explanation in the other answer as well. Selection just filters the events where as Drilldown re-runs the search with the selected values. That is why I had coded a drilldown to generate URL required where tokTime was overridden with selection time. Your option would be to code the same using JavaScript.
Here is an older answer for saving user selection to a lookup so that it loads with selection when next user logs in. May be you can explore this as well: https://answers.splunk.com/answers/617305/how-can-i-give-the-to-the-users-to-save-their-sele.html
But if you are using JavaScript, then you can better code Selection behavior directly in the code rather than using this option.
| makeresults | eval message= "Happy Splunking!!!"
- Mark as New
- Bookmark Message
- Subscribe to Message
- Mute Message
- Subscribe to RSS Feed
- Permalink
- Report Inappropriate Content
imagine i have this selection, when i duplicate the page in chrome i want to see this time window but it gets reset.

- Mark as New
- Bookmark Message
- Subscribe to Message
- Mute Message
- Subscribe to RSS Feed
- Permalink
- Report Inappropriate Content
Hi avatar image ,
in the main dashboard you have to insert in the url the time tokens:
secondary_dashboard?TimeFrom=$Time.earliest$&TimeTo=$Time.latest$
where Time is the name of the Token I used in Input panel.
Then in the secondary dashboard, after the search, you can use:
  <earliest>$TimeFrom$</earliest>
  <latest>$TimeTo$</latest>
Bye.
Giuseppe
- Mark as New
- Bookmark Message
- Subscribe to Message
- Mute Message
- Subscribe to RSS Feed
- Permalink
- Report Inappropriate Content
Hi,
it's the same dashboard the xml code is the same, i just want the other person to see what im seeing at that moment. My tokens are going correctly in the url but when the dashboard opens the selection.earliest is set to the default time token value.
Thanks.
- Mark as New
- Bookmark Message
- Subscribe to Message
- Mute Message
- Subscribe to RSS Feed
- Permalink
- Report Inappropriate Content
Hi monteiroh,
check the url you used, especially upper and lower case, because I have many dashboard running in this way!
Then check the time values you're passing to the url, maybe this is the problem!
Otherwise, you could try to use the loadjob command (see https://docs.splunk.com/Documentation/Splunk/7.1.1/Search/Aboutjobsandjobmanagement and https://docs.splunk.com/Documentation/Splunk/7.1.1/SearchReference/Loadjob ).
in other words, Splunk saves the results of a search for a defined time, if you want to reuse thise results, you can run the loadjob command and use the search results.
in this way your search is very quick, but it can be used only for a defined time.
Bye.
Giuseppe
- Mark as New
- Bookmark Message
- Subscribe to Message
- Mute Message
- Subscribe to RSS Feed
- Permalink
- Report Inappropriate Content
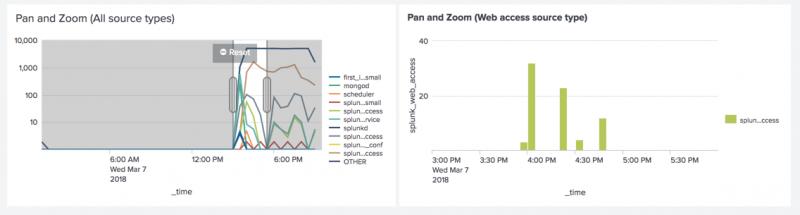
The problem is related to the token $start$ and $end$ that default to the time range picker values. So when the url is sent to another person the token goes with the correct value but when the the dashboard runs again the value changes and resets to the initial value. ex: in this image the zoom is selected what happens in my case is that in the new page the window will reset to the total time window.
- Mark as New
- Bookmark Message
- Subscribe to Message
- Mute Message
- Subscribe to RSS Feed
- Permalink
- Report Inappropriate Content
@monteiroh, please share your current drilldown code.
Also elaborate on the expectation.
Do you want the Second Panel i.e. Pan and Zoom in the screenshot Above to be sent to other users?
How are you sharing the URL? By copy pasting the current URL or as a Drilldown from Second Panel i.e. Pan and Zoom.
A mock up of what is current behavior and what is expected behavior will help us assist you better.
| makeresults | eval message= "Happy Splunking!!!"
- Mark as New
- Bookmark Message
- Subscribe to Message
- Mute Message
- Subscribe to RSS Feed
- Permalink
- Report Inappropriate Content
im sharing the url by copy pasting. currently i have this
  selection
      <eval token="form.selection.earliest">$start$</eval>
      <eval token="form.selection.latest">$end$</eval>
   /selection
The problem is when the dashboard is shared the time window selected is lost and i see all chart with no window selected.
- Mark as New
- Bookmark Message
- Subscribe to Message
- Mute Message
- Subscribe to RSS Feed
- Permalink
- Report Inappropriate Content
the problem here is related with $start$ and $end$ tokens, when the dashboard is shared they default to the time range of the full chart window @niketnilay

AppDynamics Summer Webinars
SOCin’ it to you at Splunk University
Credit Card Data Protection & PCI Compliance with Splunk Edge Processor
