Are you a member of the Splunk Community?
- Find Answers
- :
- Splunk Administration
- :
- Deployment Architecture
- :
- Why are some of the Linux timestamps not parsing?
- Subscribe to RSS Feed
- Mark Topic as New
- Mark Topic as Read
- Float this Topic for Current User
- Bookmark Topic
- Subscribe to Topic
- Mute Topic
- Printer Friendly Page
- Mark as New
- Bookmark Message
- Subscribe to Message
- Mute Message
- Subscribe to RSS Feed
- Permalink
- Report Inappropriate Content
I tried importing these on a different non production system, and some new information came to light. This post has now been heavily edited....
I recently added several servers to our splunk system, and they are all reporting as sourcetype=linux_audit
Looking at the logs, I am pretty sure they are from redhat (or similar).
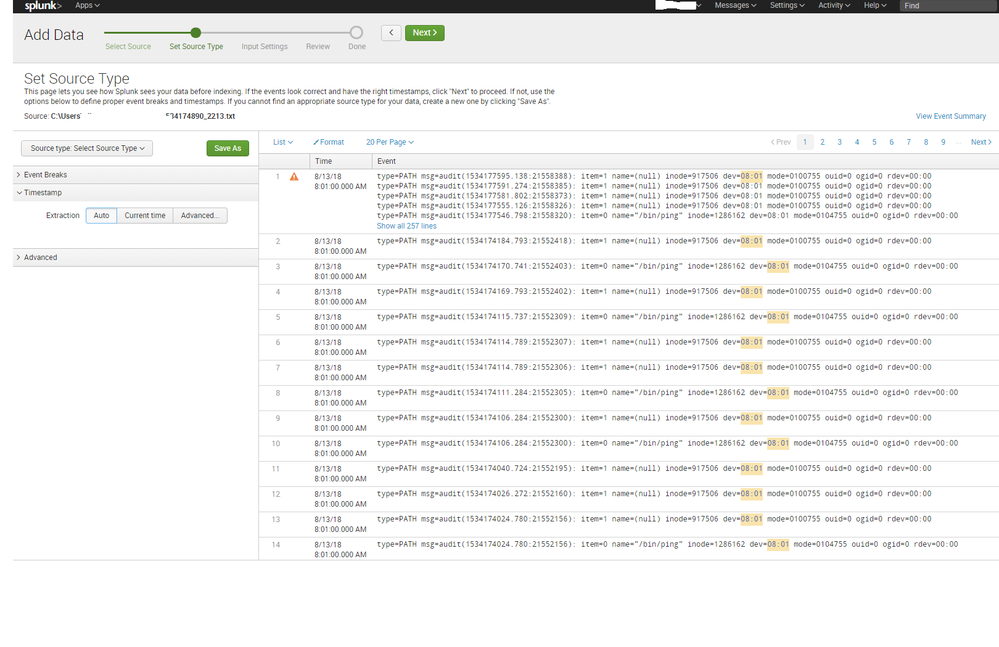
On some machines, when I go through my logs, I see that many logs from this sourcetype are using a completely inaccurate timestamp based on a different non-timey field. This is leading to about a million logs indexing in a single millisecond at the beginning of the minute.
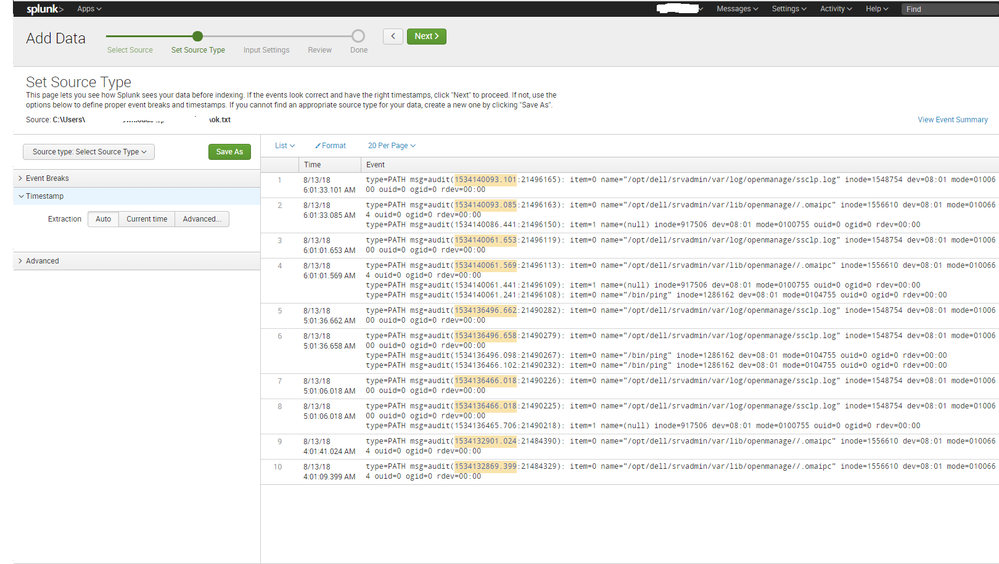
Raw log export from the "ok" logs:
type=PATH msg=audit(1534140093.101:21496165): item=0 name="/opt/dell/srvadmin/var/log/openmanage/ssclp.log" inode=1548754 dev=08:01 mode=0100600 ouid=0 ogid=0 rdev=00:00
type=PATH msg=audit(1534140093.085:21496163): item=0 name="/opt/dell/srvadmin/var/lib/openmanage//.omaipc" inode=1556610 dev=08:01 mode=0100664 ouid=0 ogid=0 rdev=00:00
type=PATH msg=audit(1534140086.441:21496150): item=1 name=(null) inode=917506 dev=08:01 mode=0100755 ouid=0 ogid=0 rdev=00:00
type=PATH msg=audit(1534140061.653:21496119): item=0 name="/opt/dell/srvadmin/var/log/openmanage/ssclp.log" inode=1548754 dev=08:01 mode=0100600 ouid=0 ogid=0 rdev=00:00
type=PATH msg=audit(1534140061.569:21496113): item=0 name="/opt/dell/srvadmin/var/lib/openmanage//.omaipc" inode=1556610 dev=08:01 mode=0100664 ouid=0 ogid=0 rdev=00:00
type=PATH msg=audit(1534140061.441:21496109): item=1 name=(null) inode=917506 dev=08:01 mode=0100755 ouid=0 ogid=0 rdev=00:00
Raw log export from the not_ok logs:
type=PATH msg=audit(1534175054.889:21553987): item=1 name=(null) inode=917506 dev=08:01 mode=0100755 ouid=0 ogid=0 rdev=00:00
type=PATH msg=audit(1534175054.885:21553986): item=1 name=(null) inode=917506 dev=08:01 mode=0100755 ouid=0 ogid=0 rdev=00:00
type=PATH msg=audit(1534175050.889:21553982): item=0 name="/bin/ping" inode=1286162 dev=08:01 mode=0104755 ouid=0 ogid=0 rdev=00:00
type=PATH msg=audit(1534175044.885:21553976): item=1 name=(null) inode=917506 dev=08:01 mode=0100755 ouid=0 ogid=0 rdev=00:00
type=PATH msg=audit(1534175036.428:21553965): item=0 name="/bin/ping" inode=1286162 dev=08:01 mode=0104755 ouid=0 ogid=0 rdev=00:00
type=PATH msg=audit(1534174959.872:21553690): item=1 name=(null) inode=917506 dev=08:01 mode=0100755 ouid=0 ogid=0 rdev=00:00
type=PATH msg=audit(1534174956.416:21553686): item=0 name="/bin/ping" inode=1286162 dev=08:01 mode=0104755 ouid=0 ogid=0 rdev=00:00
type=PATH msg=audit(1534174954.876:21553684): item=1 name=(null) inode=917506 dev=08:01 mode=0100755 ouid=0 ogid=0 rdev=00:00
Looking at those, I see no differences. BUT, splunk does!
I exported these files, and went to import them into a different system and I noticed that Splunk was grabbing the timestamp from the wrong field, but only sometimes. (These "ok" and "not_ok" logs are chronologically mixed together, even if the search result says they are not)
Screenshot of the "not_ok"
Screenshot of the "ok"
- Mark as New
- Bookmark Message
- Subscribe to Message
- Mute Message
- Subscribe to RSS Feed
- Permalink
- Report Inappropriate Content
1364481363.243 is over 5 years ago, which puts it outside of Splunk's default "MAX_DAYS_AGO" limit (2000 days).
Typically such logs would get passed through a syslog engine that adds a header with timestamp and host, so you could take the timestamp from there.
But configuring timestamping and linebreaking in props.conf for this sourcetype should be fairly simple, right?
TIME_PREFIX = msg=audit\(
MAX_TIMESTAMP_LOOKAHEAD = 25
TIME_FORMAT = %s.%3N
LINE_BREAKER = ([\r\n]+)type=\S+\s+msg=audit
SHOULD_LINEMERGE = false
(this parses the xxxxxxxx.xxx part as an epoch timestamp + milliseconds; not sure what the :xxxxx part is about...)
- Mark as New
- Bookmark Message
- Subscribe to Message
- Mute Message
- Subscribe to RSS Feed
- Permalink
- Report Inappropriate Content
Hello, this looks good however I'm getting error on UF 6.x when restarted :
Checking conf files for problems...
Bad regex value: '([\r\n]+)type=\S+\s+\msg=audit', of param: props.conf / [linux_audit] / LINE_BREAKER; why: unrecognized character follows \
One or more regexes in your configuration are not valid. For details, please see btool.log or directly above.
Done
.
- Mark as New
- Bookmark Message
- Subscribe to Message
- Mute Message
- Subscribe to RSS Feed
- Permalink
- Report Inappropriate Content
Hmm, I guess that \ in front of msg= shouldn't be there. Try removing that. Not sure how I got that there.
But setting LINE_BREAKER on a UF isn't very useful anyway, as that doesn't do anything with line breaking.
- Mark as New
- Bookmark Message
- Subscribe to Message
- Mute Message
- Subscribe to RSS Feed
- Permalink
- Report Inappropriate Content
solved, thanks, maybe bad copy/paste 🙂
- Mark as New
- Bookmark Message
- Subscribe to Message
- Mute Message
- Subscribe to RSS Feed
- Permalink
- Report Inappropriate Content
Cool 🙂
Updated it in my answer as well, in case someone else stumbles upon this post in the future 🙂
- Mark as New
- Bookmark Message
- Subscribe to Message
- Mute Message
- Subscribe to RSS Feed
- Permalink
- Report Inappropriate Content
You my want to set MAX_TIMESTAMP_LOOKAHEAD = 14
The timestamp is 1534140093.101which is 14 chars after the declared TIME_PREFIX
The :21496165 is a ID number
HTH
Shaky
- Mark as New
- Bookmark Message
- Subscribe to Message
- Mute Message
- Subscribe to RSS Feed
- Permalink
- Report Inappropriate Content
That was a sample log from redhat.
I am transferring some screenshots and sample raw logs.
This problem is evolving, and the screenshots should give a lot more context to my question.
- Mark as New
- Bookmark Message
- Subscribe to Message
- Mute Message
- Subscribe to RSS Feed
- Permalink
- Report Inappropriate Content
Updated!
Hopefully that will clarify my issue.
- Mark as New
- Bookmark Message
- Subscribe to Message
- Mute Message
- Subscribe to RSS Feed
- Permalink
- Report Inappropriate Content
Got it, thanks for the screenshots.
Not entirely sure why Splunk is behaving the way it does here. But this is a clear example of why you don't want to rely on automatic timestamping and linebreaking (your linebreaking is also failing miserably). Apart from a very significant performance impact, it also simply isn't reliable in all cases.
So just define that yourself, as already sketched in my answer above. I've added linebreaking settings as well now.
- Mark as New
- Bookmark Message
- Subscribe to Message
- Mute Message
- Subscribe to RSS Feed
- Permalink
- Report Inappropriate Content
It actually doesn't need linebreaking!
The moment I put your
TIME_PREFIX = msg=audit\(
 MAX_TIMESTAMP_LOOKAHEAD = 25
 TIME_FORMAT = %s.%3N
suggestion in, the linebreaks worked perfectly as did the timestamps.
- Mark as New
- Bookmark Message
- Subscribe to Message
- Mute Message
- Subscribe to RSS Feed
- Permalink
- Report Inappropriate Content
Glad to hear that. And yes, Splunk by default breaks before each line with a timestamp or something like that. So once it has a reliable way to determine timestamps, that also helps it determine where to break. For performance reasons it may still be useful to make that explicit as well, but getting the time stamping set properly is I think the most important part.
Please mark the answer as accepted if it works for you, so others can also find that answer easily if they run into a similar issue 🙂


