Are you a member of the Splunk Community?
- News & Events
- :
- Blog & Announcements
- :
- Community Blog
- :
- Run Your Heroku app With OpenTelemetry
Run Your Heroku app With OpenTelemetry
- Subscribe to RSS Feed
- Mark as New
- Mark as Read
- Bookmark Topic
- Subscribe
- Printer Friendly Page
- Report Inappropriate Content
This blog post is part of an ongoing series on OpenTelemetry.
Heroku is a hosting service offering to run your application in a self-contained environment that you can scale over time. Heroku is impressively simple to use, with the ability to push to deploy by just pushing to their remote git repository. We have been building support for Heroku by adding a buildpack that installs the Splunk distribution of the OpenTelemetry collector to your Heroku application (called a slug).
In this blog post, we will show you how to set up your Heroku app to use our buildpack. We will show off a sample app that is able to use the collector to report metrics, traces, and profiling information to the Observability Cloud.
Prerequisites:
- You have installed the Heroku CLI.
- You have created a Heroku app.
- All commands we run will run in the checkout of your app as a git repository.
Our buildpack is open source and hosted on Github under this repository: https://github.com/signalfx/splunk-otel-collector-heroku
Install the buildpack in your Heroku app with:
heroku buildpacks:add https://github.com/signalfx/splunk-otel-collector-heroku.git#v0.0.3
The #0.0.3 segment here represents the current version of the buildpack. Make sure to change it as needed to target the latest version.
Next, obtain an access token to send data to the observability cloud and set it, as well as the realm you operate in:
heroku config:set SPLUNK_ACCESS_TOKEN=1234
heroku config:set SPLUNK_REALM=us0
Optionally, you may decide to reduce the disk space used by the collector by removing the Smart Agent bundle.
heroku config:set SFX_AGENT_DISABLED=true
Now, you can deploy the app. We offer a test application under our test folder:
https://github.com/signalfx/splunk-otel-collector-heroku/tree/main/test
You can copy the contents of this application into your git repository, commit and push them to heroku to try it out:
cp -R <checkout>/test/* .
git add -A
git commit -m “initial commit”
git push heroku main
This will show you the deployment of the application to heroku.
You can then go to your application HTTP URL and you will be greeted with:
We instrument node with the -r argument loading this file:
const { start } = require('@splunk/otel');
const { HttpInstrumentation } = require('@opentelemetry/instrumentation-http');
const { getInstrumentations } = require('@splunk/otel/lib/instrumentations');

delete process.env.SPLUNK_REALM;

start({
    endpoint: 'http://localhost:4317',
    metrics: {
        exportIntervalMillis: 30000, // default: 5000
    },
    profiling: { memoryProfilingEnabled: true },
    tracing: {
        instrumentations: [
            ...getInstrumentations(),
            new HttpInstrumentation({
                headersToSpanAttributes: {
                    // Server side capturing, e.g. express
                    server: {
                        // Outgoing response headers
                        responseHeaders: ['content-type'],

                        // Incoming request headers

                        requestHeaders: ['accept-language']
                    },
                    // Client side capturing, e.g. node-fetch, got
                    client: {
                        // Incoming response headers
                        responseHeaders: ['server-timing'],
                        // Outgoing request headers
                        requestHeaders: ['accept-encoding']
                    }
                }
            }),
        ],
    },
});
In this file, we set the endpoint to send all data to our localhost over HTTP with port 4317. That’s where our collector resides. The data will be transmitted over the OTLP protocol JSON format.
We enable metrics, profiling, and tracing for our application with a few customizations to get more information from Express, the Node.js framework we use to respond to HTTP requests.
First, we use a customer visits metric as a counter that is incremented every time you visit. The metric is annotated with information from your heroku environment such as app id and name, revision number, release tag, and slug commit.
We collect a trace of your visit. We use auto-instrumentation to instrument Express and a custom tracer to pick your visit specifically.
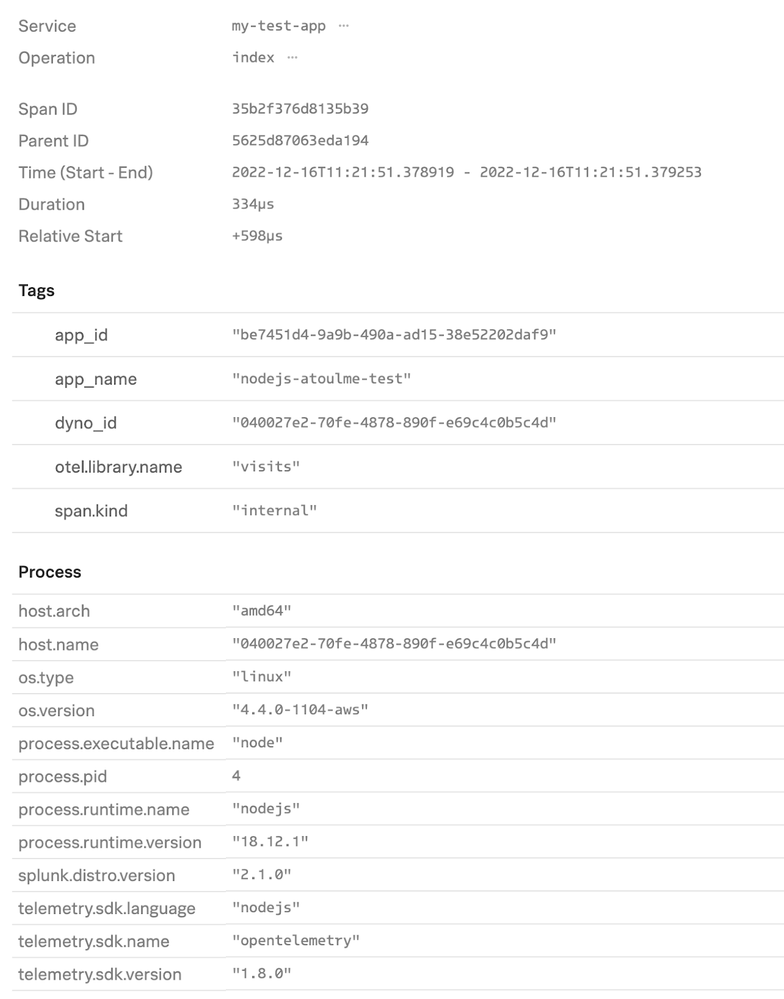
You can zoom in on a span to get more information about your application metadata.
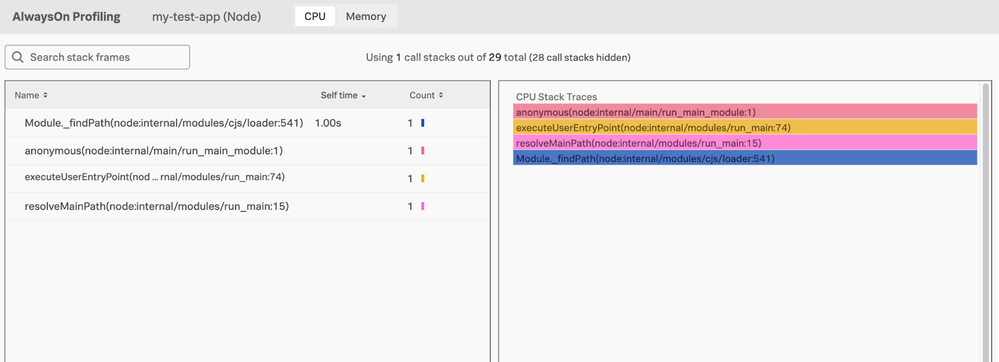
Since profiling is on, we can also visit the CPU profile of our application:
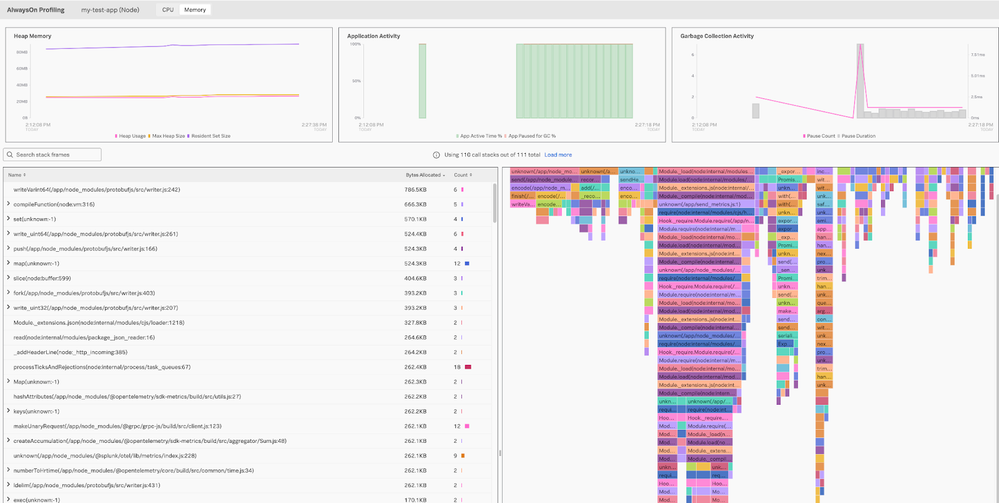
We can also visit a beautiful flame chart of the memory allocation of Node for our application:

— Antoine Toulme, Senior Engineering Manager, Blockchain & DLT
You must be a registered user to add a comment. If you've already registered, sign in. Otherwise, register and sign in.
Tech Talk Recap | Mastering Threat Hunting
Observability for AI Applications: Troubleshooting Latency
Splunk AI Assistant for SPL vs. ChatGPT: Which One is Better?
-
.conf25
26 -
App Dev
18 -
Career Report
9 -
Cisco Live
3 -
Cloud Platform
28 -
Community
39 -
Community Spotlight
21 -
Enterprise
33 -
MVP
4 -
Observability
75 -
Office Hours
20 -
OpenTelemetry
39 -
Product Announcements
11 -
Security
34 -
Splunk Lantern
53 -
Splunk Love
6 -
SplunkTrust
28 -
Tech Talks
10 -
User Groups
7


