Are you a member of the Splunk Community?
- Find Answers
- :
- Apps & Add-ons
- :
- All Apps and Add-ons
- :
- Clustered Single Value Map Visualization: Browser ...
- Subscribe to RSS Feed
- Mark Topic as New
- Mark Topic as Read
- Float this Topic for Current User
- Bookmark Topic
- Subscribe to Topic
- Mute Topic
- Printer Friendly Page
- Mark as New
- Bookmark Message
- Subscribe to Message
- Mute Message
- Subscribe to RSS Feed
- Permalink
- Report Inappropriate Content
Clustered Single Value Map Visualization: Browser hangs on the visualization
Hi,
Great job on this add-on, it is really great!
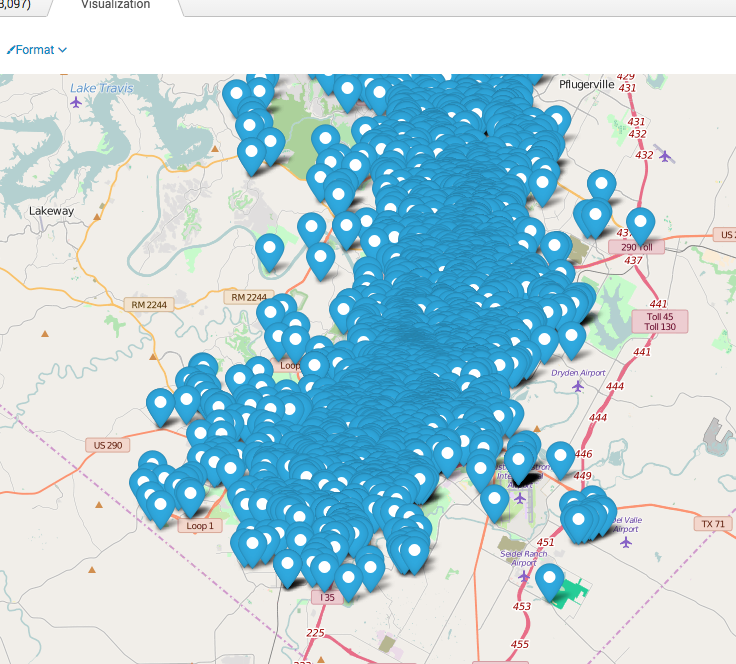
I've noticed when you use this visualization, especially when you copy a search, or open search from a dashboard that uses the add-on, the clustering of markers is disabled.
So if you have a big search attached, it will hang the browser if you try to open the visualization tab.
I've worked around it by reducing the data to something small like less than a thousand markers, go into the format and click "Disable" to "Enable Clustering", and then "Enable" again. Once you do this it works fine, until you try to copy.
Any thoughts on how to fix this?
Thanks again. This is a great add-on.
- Mark as New
- Bookmark Message
- Subscribe to Message
- Mute Message
- Subscribe to RSS Feed
- Permalink
- Report Inappropriate Content
I wasn't able to reproduce the issue running version 1.3.2 of the app and Splunk 6.4.1. I created a generic search with 251,486 lat/long pairs and saved it as a report. Clustering was enabled by default for me when viewing the report. Here's what the savedsearches.conf looks like.
[test cluster bug]
action.email.useNSSubject = 1
alert.track = 0
dispatch.earliest_time = -1y@y
dispatch.latest_time = @y
display.general.type = visualizations
display.page.search.tab = visualizations
display.statistics.show = 0
display.visualizations.custom.leaflet_maps_app.leaflet_maps.allPopups = false
display.visualizations.custom.leaflet_maps_app.leaflet_maps.animate = true
display.visualizations.custom.leaflet_maps_app.leaflet_maps.cluster = true
display.visualizations.custom.leaflet_maps_app.leaflet_maps.criticalThreshold = 80
display.visualizations.custom.leaflet_maps_app.leaflet_maps.defaultHeight = 600
display.visualizations.custom.leaflet_maps_app.leaflet_maps.fullScreen = false
display.visualizations.custom.leaflet_maps_app.leaflet_maps.mapCenterZoom = 6
display.visualizations.custom.leaflet_maps_app.leaflet_maps.mapTile = http://{s}.tile.openstreetmap.org/{z}/{x}/{y}.png
display.visualizations.custom.leaflet_maps_app.leaflet_maps.maxClusterRadius = 80
display.visualizations.custom.leaflet_maps_app.leaflet_maps.maxZoom = 19
display.visualizations.custom.leaflet_maps_app.leaflet_maps.minZoom = 1
display.visualizations.custom.leaflet_maps_app.leaflet_maps.multiplePopups = false
display.visualizations.custom.leaflet_maps_app.leaflet_maps.rangeOneBgColor = #B5E28C
display.visualizations.custom.leaflet_maps_app.leaflet_maps.rangeOneFgColor = #6ECC39
display.visualizations.custom.leaflet_maps_app.leaflet_maps.rangeThreeBgColor = #FD9C73
display.visualizations.custom.leaflet_maps_app.leaflet_maps.rangeThreeFgColor = #F18017
display.visualizations.custom.leaflet_maps_app.leaflet_maps.rangeTwoBgColor = #F1D357
display.visualizations.custom.leaflet_maps_app.leaflet_maps.rangeTwoFgColor = #F0C20C
display.visualizations.custom.leaflet_maps_app.leaflet_maps.scrollWheelZoom = true
display.visualizations.custom.leaflet_maps_app.leaflet_maps.singleMarkerMode = false
display.visualizations.custom.leaflet_maps_app.leaflet_maps.warningThreshold = 55
display.visualizations.custom.type = leaflet_maps_app.leaflet_maps
display.visualizations.type = custom
request.ui_dispatch_app = chicago_crime
request.ui_dispatch_view = search
search = index=chicago_crime latitude=\* longitude=\* | table latitude, longitude
Is cluster set to false in the savedsearches.conf for your report? If it is, I'm not sure how it got set as the default value for cluster is true.
Did you upgrade the app or is it a fresh install of 1.3.2? If it's an upgrade, I'd remove and re-install the app just to make sure something funky didn't happen during the upgrade process.
- Mark as New
- Bookmark Message
- Subscribe to Message
- Mute Message
- Subscribe to RSS Feed
- Permalink
- Report Inappropriate Content
Here is the saved search that resulted in this graph.
[Austin Crime Incidents]
action.email.useNSSubject = 1
alert.track = 0
cron_schedule = 0 0 * * *
dispatch.earliest_time = -30d@d
dispatch.latest_time = now
display.events.fields = ["location","block","time","longitude","latitude","address","strname","blk","block1","blockhi","street_name"]
display.general.timeRangePicker.show = 0
display.general.type = visualizations
display.page.search.mode = verbose
display.page.search.tab = visualizations
display.statistics.show = 0
display.visualizations.charting.chart = line
display.visualizations.custom.leaflet_maps_app.leaflet_maps.allPopups = 0
display.visualizations.custom.leaflet_maps_app.leaflet_maps.animate = 1
display.visualizations.custom.leaflet_maps_app.leaflet_maps.cluster = 1
display.visualizations.custom.leaflet_maps_app.leaflet_maps.criticalThreshold = 80
display.visualizations.custom.leaflet_maps_app.leaflet_maps.defaultHeight = 600
display.visualizations.custom.leaflet_maps_app.leaflet_maps.fullScreen = 0
display.visualizations.custom.leaflet_maps_app.leaflet_maps.mapCenterLat = 30.26758286
display.visualizations.custom.leaflet_maps_app.leaflet_maps.mapCenterLon = -97.73992754
display.visualizations.custom.leaflet_maps_app.leaflet_maps.mapCenterZoom = 11
display.visualizations.custom.leaflet_maps_app.leaflet_maps.mapTile = http://{s}.tile.openstreetmap.org/{z}/{x}/{y}.png
display.visualizations.custom.leaflet_maps_app.leaflet_maps.maxClusterRadius = 80
display.visualizations.custom.leaflet_maps_app.leaflet_maps.maxZoom = 19
display.visualizations.custom.leaflet_maps_app.leaflet_maps.minZoom = 1
display.visualizations.custom.leaflet_maps_app.leaflet_maps.multiplePopups = 0
display.visualizations.custom.leaflet_maps_app.leaflet_maps.rangeOneBgColor = #B5E28C
display.visualizations.custom.leaflet_maps_app.leaflet_maps.rangeOneFgColor = #6ECC39
display.visualizations.custom.leaflet_maps_app.leaflet_maps.rangeThreeBgColor = #FD9C73
display.visualizations.custom.leaflet_maps_app.leaflet_maps.rangeThreeFgColor = #F18017
display.visualizations.custom.leaflet_maps_app.leaflet_maps.rangeTwoBgColor = #F1D357
display.visualizations.custom.leaflet_maps_app.leaflet_maps.rangeTwoFgColor = #F0C20C
display.visualizations.custom.leaflet_maps_app.leaflet_maps.scrollWheelZoom = 1
display.visualizations.custom.leaflet_maps_app.leaflet_maps.singleMarkerMode = 0
display.visualizations.custom.leaflet_maps_app.leaflet_maps.warningThreshold = 55
display.visualizations.custom.type = leaflet_maps_app.leaflet_maps
display.visualizations.type = custom
enableSched = 1
request.ui_dispatch_app = search
request.ui_dispatch_view = search
search = index=socrata-austin-crime
- Mark as New
- Bookmark Message
- Subscribe to Message
- Mute Message
- Subscribe to RSS Feed
- Permalink
- Report Inappropriate Content
These lines look suspicious and aren't in my savedsearches.conf. I'm not sure if they make a difference but they probably shouldn't be in there.
display.visualizations.charting.chart = line
display.page.search.mode = verbose
Here's what mine looks like
[cluster bug test 2]
action.email.useNSSubject = 1
alert.track = 0
cron_schedule = \*/5 \* \* \* \*
dispatch.earliest_time = -1y@y
dispatch.latest_time = @y
display.general.type = visualizations
display.page.search.tab = visualizations
display.statistics.show = 0
display.visualizations.custom.leaflet_maps_app.leaflet_maps.allPopups = 0
display.visualizations.custom.leaflet_maps_app.leaflet_maps.animate = 1
display.visualizations.custom.leaflet_maps_app.leaflet_maps.cluster = 1
display.visualizations.custom.leaflet_maps_app.leaflet_maps.criticalThreshold = 80
display.visualizations.custom.leaflet_maps_app.leaflet_maps.defaultHeight = 600
display.visualizations.custom.leaflet_maps_app.leaflet_maps.fullScreen = 0
display.visualizations.custom.leaflet_maps_app.leaflet_maps.mapCenterLat = 39.50
display.visualizations.custom.leaflet_maps_app.leaflet_maps.mapCenterLon = -98.35
display.visualizations.custom.leaflet_maps_app.leaflet_maps.mapCenterZoom = 6
display.visualizations.custom.leaflet_maps_app.leaflet_maps.mapTile = http://{s}.tile.openstreetmap.org/{z}/{x}/{y}.png
display.visualizations.custom.leaflet_maps_app.leaflet_maps.maxClusterRadius = 80
display.visualizations.custom.leaflet_maps_app.leaflet_maps.maxZoom = 19
display.visualizations.custom.leaflet_maps_app.leaflet_maps.minZoom = 1
display.visualizations.custom.leaflet_maps_app.leaflet_maps.multiplePopups = 0
display.visualizations.custom.leaflet_maps_app.leaflet_maps.rangeOneBgColor = #B5E28C
display.visualizations.custom.leaflet_maps_app.leaflet_maps.rangeOneFgColor = #6ECC39
display.visualizations.custom.leaflet_maps_app.leaflet_maps.rangeThreeBgColor = #FD9C73
display.visualizations.custom.leaflet_maps_app.leaflet_maps.rangeThreeFgColor = #F18017
display.visualizations.custom.leaflet_maps_app.leaflet_maps.rangeTwoBgColor = #F1D357
display.visualizations.custom.leaflet_maps_app.leaflet_maps.rangeTwoFgColor = #F0C20C
display.visualizations.custom.leaflet_maps_app.leaflet_maps.scrollWheelZoom = 1
display.visualizations.custom.leaflet_maps_app.leaflet_maps.singleMarkerMode = 0
display.visualizations.custom.leaflet_maps_app.leaflet_maps.warningThreshold = 55
display.visualizations.custom.type = leaflet_maps_app.leaflet_maps
display.visualizations.type = custom
enableSched = 1
request.ui_dispatch_app = chicago_crime
request.ui_dispatch_view = search
search = index=chicago_crime latitude=\* longitude=\* | table latitude, longitude
- Mark as New
- Bookmark Message
- Subscribe to Message
- Mute Message
- Subscribe to RSS Feed
- Permalink
- Report Inappropriate Content
deleted those with no effect.
- Mark as New
- Bookmark Message
- Subscribe to Message
- Mute Message
- Subscribe to RSS Feed
- Permalink
- Report Inappropriate Content
Hey. Sorry, but it still has the same result. I removed the old version at the CLI, and installed 1.3.3, but it still failed on the report.
I tried to get to the "save as" report a few different ways, but got the same result.
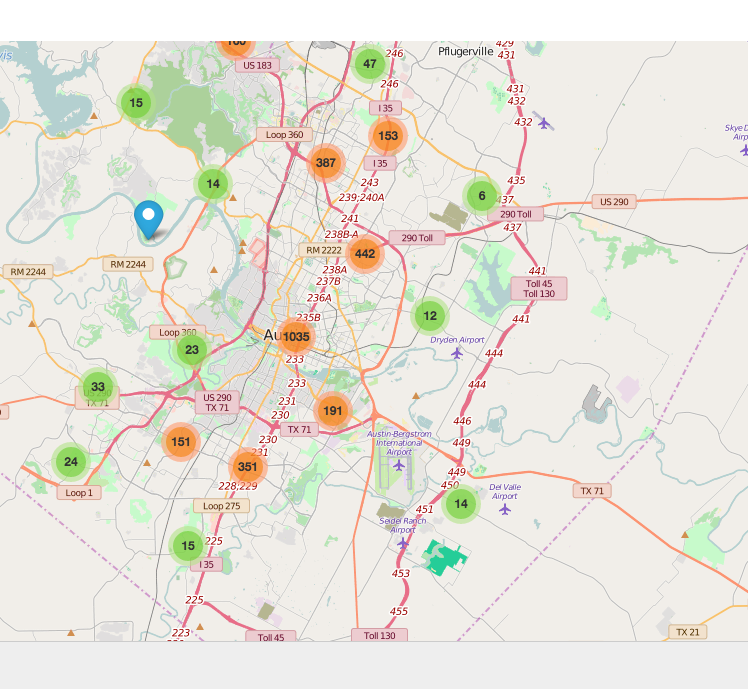
Here is the result from a search.
I saved this as a report. Scheduled it, and let it run.
This is what happens when I display the report, or if I "run" it from the reports listing page.

- Mark as New
- Bookmark Message
- Subscribe to Message
- Mute Message
- Subscribe to RSS Feed
- Permalink
- Report Inappropriate Content
That's strange. I don't see the same behavior. Did you re-create the saved search and re-schedule it after removing/installing 1.3.3 or is it the original saved search from savedsearches.conf?
- Mark as New
- Bookmark Message
- Subscribe to Message
- Mute Message
- Subscribe to RSS Feed
- Permalink
- Report Inappropriate Content
I've posted an updated version 1.3.3 on Splunkbase. Please give that a try and let me know if it works for you.
- Mark as New
- Bookmark Message
- Subscribe to Message
- Mute Message
- Subscribe to RSS Feed
- Permalink
- Report Inappropriate Content
I was able to replicate the issue and fix the problem. I'll post a new version of the app today. Thank you for bringing this to my attention! I really appreciate it.
- Mark as New
- Bookmark Message
- Subscribe to Message
- Mute Message
- Subscribe to RSS Feed
- Permalink
- Report Inappropriate Content
NP. Glad it was fixable.
- Mark as New
- Bookmark Message
- Subscribe to Message
- Mute Message
- Subscribe to RSS Feed
- Permalink
- Report Inappropriate Content
To be more precise. I can create the report, and then view it.
At this point, everything is fine.
If I then SCHEDULE (scheduled saved search), that's when it appears the cluster's won't show.
The report runs on the schedule, and then when viewing the scheduled data the map shows with only markers.
- Mark as New
- Bookmark Message
- Subscribe to Message
- Mute Message
- Subscribe to RSS Feed
- Permalink
- Report Inappropriate Content
Thanks for clarifying. I'll test this today and see what happens for me.
- Mark as New
- Bookmark Message
- Subscribe to Message
- Mute Message
- Subscribe to RSS Feed
- Permalink
- Report Inappropriate Content
Just ran this again and still have a problem.
So the app works fine with creating new searches, cloning searches, and dashboards. However, the clustering fails to work in a report. It defaults to markers.
Is this expected that it can't run in a report?
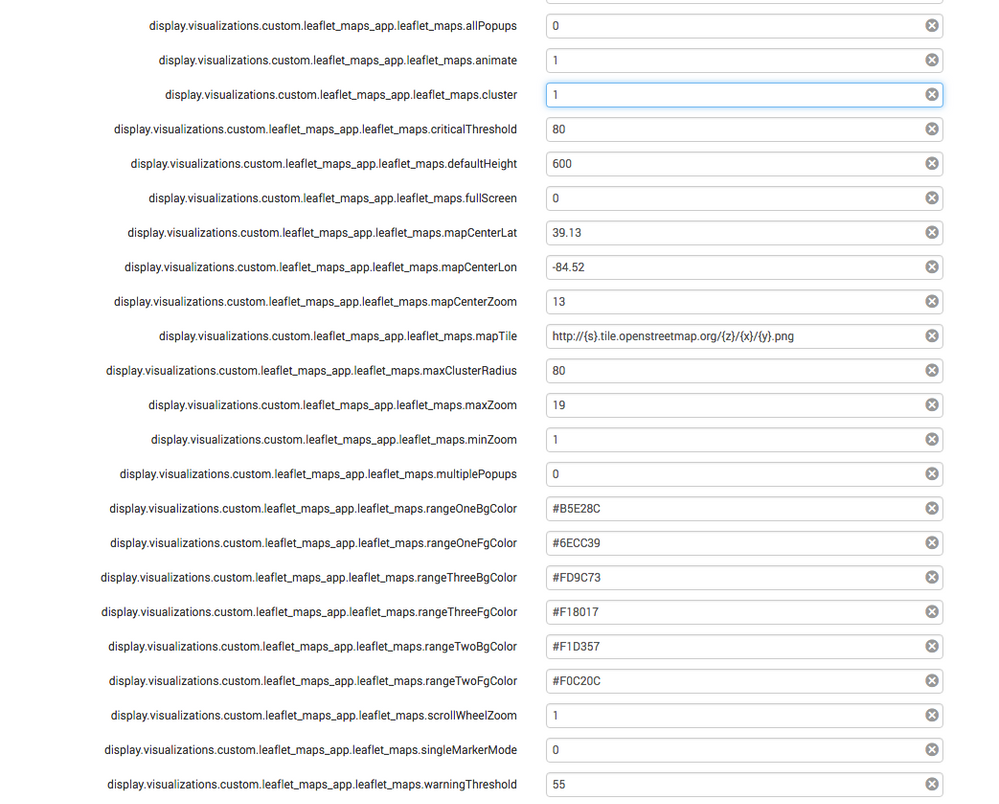
Below is the section of an advanced edit of the saved search, and here is an image of the result.
- Mark as New
- Bookmark Message
- Subscribe to Message
- Mute Message
- Subscribe to RSS Feed
- Permalink
- Report Inappropriate Content
It turns out it must have been an incomplete update.
I removed and re-installed the add-on, and the defaults were set properly.
Everything works fine now. Thanks for the your suggestion.
- Mark as New
- Bookmark Message
- Subscribe to Message
- Mute Message
- Subscribe to RSS Feed
- Permalink
- Report Inappropriate Content
Thanks. I'll see if I can reproduce the issue and report back soon. I appreciate the feedback.
- Mark as New
- Bookmark Message
- Subscribe to Message
- Mute Message
- Subscribe to RSS Feed
- Permalink
- Report Inappropriate Content
The easiest way to recreate would be to create a visualization using the add-on, and then create a report. If it works for you, then I have something wrong with my install. I checked the default savedsearches.conf and it was set to cluster.
- Mark as New
- Bookmark Message
- Subscribe to Message
- Mute Message
- Subscribe to RSS Feed
- Permalink
- Report Inappropriate Content
Hi,
If I get it to work, and then create a report, I get the same result.
Thanks again.
- Mark as New
- Bookmark Message
- Subscribe to Message
- Mute Message
- Subscribe to RSS Feed
- Permalink
- Report Inappropriate Content
I'm using version 1.3.2
- Mark as New
- Bookmark Message
- Subscribe to Message
- Mute Message
- Subscribe to RSS Feed
- Permalink
- Report Inappropriate Content
The visualization itself seems to work great with up to 20,000 points or more. I wouldn't try to run it with the Clustering disabled, but it seems to default to that setting in these cases
- Mark as New
- Bookmark Message
- Subscribe to Message
- Mute Message
- Subscribe to RSS Feed
- Permalink
- Report Inappropriate Content
Most of my use-cases have less than 1000 points.
- Mark as New
- Bookmark Message
- Subscribe to Message
- Mute Message
- Subscribe to RSS Feed
- Permalink
- Report Inappropriate Content
I'm glad you're liking the visualization! Thanks for using it.
Can you tell me what version of the app you're running and how many data points you have?


