Are you a member of the Splunk Community?
- Find Answers
- :
- Using Splunk
- :
- Splunk Search
- :
- Re: how to use a field as timestamp with epoch tim...
- Subscribe to RSS Feed
- Mark Topic as New
- Mark Topic as Read
- Float this Topic for Current User
- Bookmark Topic
- Subscribe to Topic
- Mute Topic
- Printer Friendly Page
- Mark as New
- Bookmark Message
- Subscribe to Message
- Mute Message
- Subscribe to RSS Feed
- Permalink
- Report Inappropriate Content
how to use a field as timestamp with epoch time for a timechart
Hi there,
I did already several trials with search commands like "eval _time=strptime(time,"%Y-%m-%dT%H:%M:%S")"
but was not able to manage that time chart is using my own timestamp in the message uploaded.
The data has originally same _time as the upload is done by bulk upload of a log file that contains then several events with there own timestamp in the format: time: 2020-11-16T15:15:51.113394
I'd like to show cpu_percentage over my own time stamp.
Hope somebody can help out here
Ralf
- Mark as New
- Bookmark Message
- Subscribe to Message
- Mute Message
- Subscribe to RSS Feed
- Permalink
- Report Inappropriate Content
yes, time: 2020-11-16T15:15:51.113394. is part of my event
- Mark as New
- Bookmark Message
- Subscribe to Message
- Mute Message
- Subscribe to RSS Feed
- Permalink
- Report Inappropriate Content
Has time been successfully extracted from your events?
- Mark as New
- Bookmark Message
- Subscribe to Message
- Mute Message
- Subscribe to RSS Feed
- Permalink
- Report Inappropriate Content
sorry, what do you mean by "extracted" ?
What I can see, please see also the screen dump on my question is, that the time field in the message show a different time than Splunk time.
That I would say can be expected as Splunk recognize the time of uploading
- Mark as New
- Bookmark Message
- Subscribe to Message
- Mute Message
- Subscribe to RSS Feed
- Permalink
- Report Inappropriate Content
If you expand the event
Do you see time (as well as _time) as a field?
- Mark as New
- Bookmark Message
- Subscribe to Message
- Mute Message
- Subscribe to RSS Feed
- Permalink
- Report Inappropriate Content
looks like this:
- Mark as New
- Bookmark Message
- Subscribe to Message
- Mute Message
- Subscribe to RSS Feed
- Permalink
- Report Inappropriate Content
The eval you mentioned should work so long as you do it before the timechart. What do you get if you do the eval and then expand the event as before - does _time = time?
- Mark as New
- Bookmark Message
- Subscribe to Message
- Mute Message
- Subscribe to RSS Feed
- Permalink
- Report Inappropriate Content
original message looks like this:
after trying with this eval command: - don't know if it is 100% correct
eval _time=strptime(time,"%Y-%m-%d %H:%M:%S.%Q")
it looks like this
- Mark as New
- Bookmark Message
- Subscribe to Message
- Mute Message
- Subscribe to RSS Feed
- Permalink
- Report Inappropriate Content
It looks like the eval worked - so timechart should now work as it uses _time
- Mark as New
- Bookmark Message
- Subscribe to Message
- Mute Message
- Subscribe to RSS Feed
- Permalink
- Report Inappropriate Content
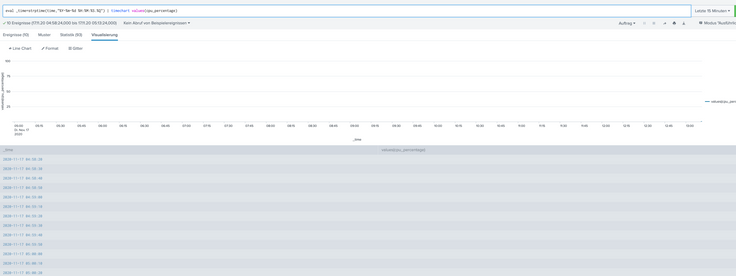
unfortunately not:
everything looks empty even when I saw the events are there
- Mark as New
- Bookmark Message
- Subscribe to Message
- Mute Message
- Subscribe to RSS Feed
- Permalink
- Report Inappropriate Content
Interesting picture. You are doing a timechart using values. If you look at the statistics, you will probably see a multivalue field values(cpu_percentage) against each time bucket (quarter of an hour). This cannot be visualised in this way. What is it you are trying to achieve?


