Are you a member of the Splunk Community?
- Find Answers
- :
- Using Splunk
- :
- Splunk Search
- :
- Re: Why is extracted field not showing up in the r...
- Subscribe to RSS Feed
- Mark Topic as New
- Mark Topic as Read
- Float this Topic for Current User
- Bookmark Topic
- Subscribe to Topic
- Mute Topic
- Printer Friendly Page
- Mark as New
- Bookmark Message
- Subscribe to Message
- Mute Message
- Subscribe to RSS Feed
- Permalink
- Report Inappropriate Content
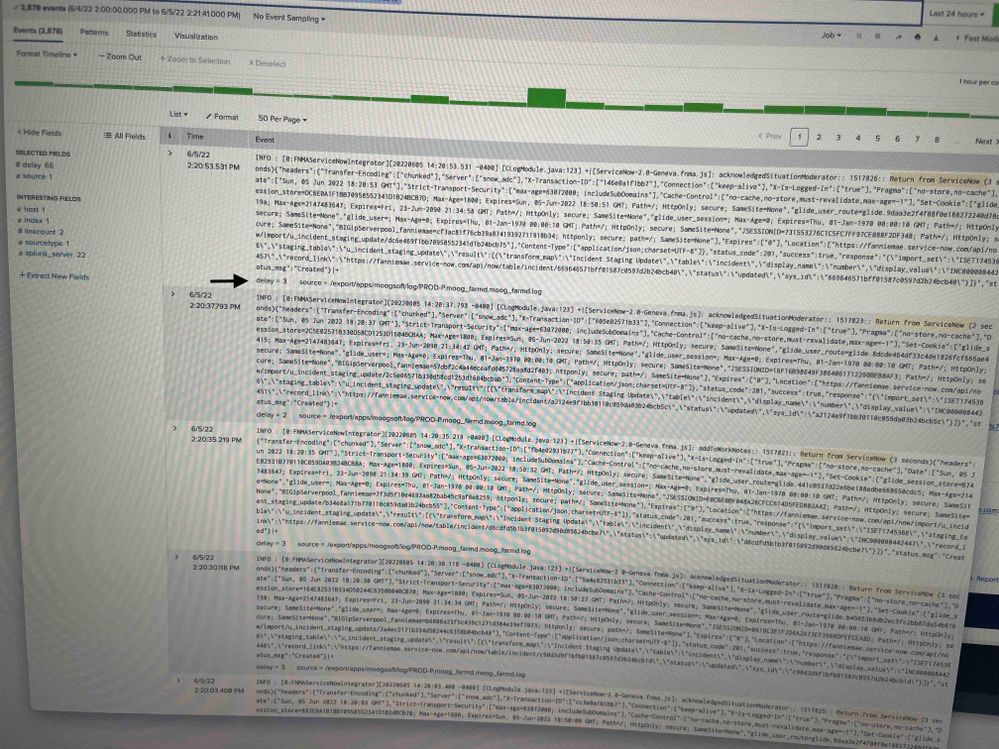
I have a search criteria with extraction, It seems to be extracting the value. But it's showing up in it's own column.
index=moogsoft "Return from ServiceNow (" | rex "Return from ServiceNow \((?<delay>\d+) seconds\)"
In the results page, I am only seeing the timestamp, the event, the extracted delay variable below the event. How do I display so the delay shows up in it's own column next to the event.
- Mark as New
- Bookmark Message
- Subscribe to Message
- Mute Message
- Subscribe to RSS Feed
- Permalink
- Report Inappropriate Content
Hi @rmalghan,
let me understand: instead of the normal "List" view, you want a table with the following columns: timestamp, delay, events, is this correct?
If this is your need, you have to select "Table" instead of "List" (in the dropdown near Format).
This view displays only the fields you have in the "selected Fields" list, so you can choose the ones you like.
Ciao.
Giuseppe
- Mark as New
- Bookmark Message
- Subscribe to Message
- Mute Message
- Subscribe to RSS Feed
- Permalink
- Report Inappropriate Content
When I do that, yes I get the delay in a new column. But the event (raw log goes away). I see _time, delay and source columns. How do I include the actual full event. When I click "All Fields", don't see the option to select the event
- Mark as New
- Bookmark Message
- Subscribe to Message
- Mute Message
- Subscribe to RSS Feed
- Permalink
- Report Inappropriate Content
- Mark as New
- Bookmark Message
- Subscribe to Message
- Mute Message
- Subscribe to RSS Feed
- Permalink
- Report Inappropriate Content
- Mark as New
- Bookmark Message
- Subscribe to Message
- Mute Message
- Subscribe to RSS Feed
- Permalink
- Report Inappropriate Content
You can click on the "All fields" label on the left side of the screen and then add selected field(s) to the list of the interesting fields which will be displayed immediately below the raw event in the list view.

