Are you a member of the Splunk Community?
- Find Answers
- :
- Using Splunk
- :
- Splunk Search
- :
- Why does the clickable pie chart only show the IP ...
- Subscribe to RSS Feed
- Mark Topic as New
- Mark Topic as Read
- Float this Topic for Current User
- Bookmark Topic
- Subscribe to Topic
- Mute Topic
- Printer Friendly Page
- Mark as New
- Bookmark Message
- Subscribe to Message
- Mute Message
- Subscribe to RSS Feed
- Permalink
- Report Inappropriate Content
Why does the clickable pie chart only show the IP address in question?
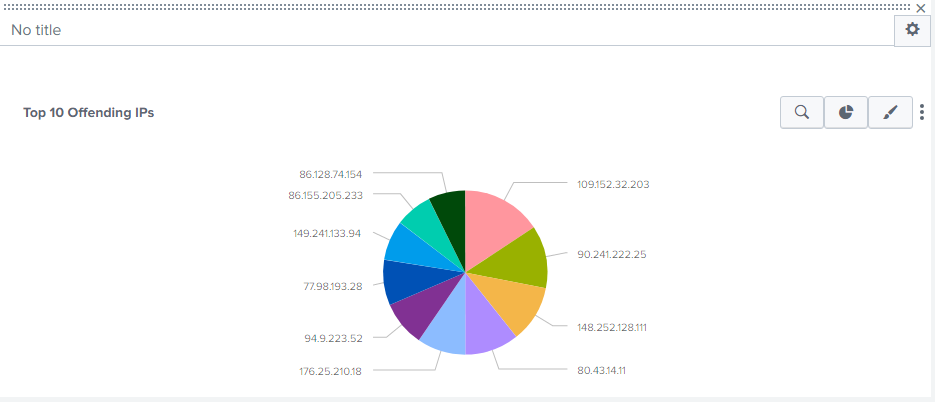
I have a pie chart displaying the top 10 ip address for the past 60 minutes, and I'm trying to figure out how to then be able to click that bit of the pie chart, to then open a new window relevant information about that specific ip address instead of all the IP addresses in the pie chart
- Mark as New
- Bookmark Message
- Subscribe to Message
- Mute Message
- Subscribe to RSS Feed
- Permalink
- Report Inappropriate Content
Okay so just to update, on the pie chart we have 10 offending ip addresses.
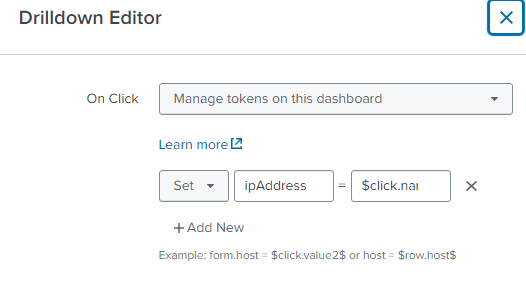
The drilldown options are set as follows:
And so when I click on one of the ip address on the pie chart, I want a table below to be populated with the following details regarding that ip address: ipAddress, username, error, _time. However this is what appears when I click on any of the ip addresses in the pie chart
- Mark as New
- Bookmark Message
- Subscribe to Message
- Mute Message
- Subscribe to RSS Feed
- Permalink
- Report Inappropriate Content
Change the drilldown option to "Link to search" and choose "Custom". Enter into the "Search string" box the SPL needed to create the desired table. Use $click.value2$ to refer to the selected IP address.
If this reply helps you, Karma would be appreciated.
- Mark as New
- Bookmark Message
- Subscribe to Message
- Mute Message
- Subscribe to RSS Feed
- Permalink
- Report Inappropriate Content
Thanks, I'll try that ASAP!
- Mark as New
- Bookmark Message
- Subscribe to Message
- Mute Message
- Subscribe to RSS Feed
- Permalink
- Report Inappropriate Content
Define a drilldown for the chart that links to a search. The search should reference the $click.value2$ token to find only the clicked IP address.
If this reply helps you, Karma would be appreciated.
- Mark as New
- Bookmark Message
- Subscribe to Message
- Mute Message
- Subscribe to RSS Feed
- Permalink
- Report Inappropriate Content
Hi @jhilton90,
you need to explore the drilldown feature:
https://docs.splunk.com/Documentation/Splunk/9.0.1/Viz/DrilldownIntro
https://docs.splunk.com/Documentation/Splunk/9.0.1/Viz/DrilldownIntro
and many other videos on the YouTube Splunk Channel.
I cannot help you more, because it depends on your dashboard, anyway, you could use the GUI drilldown feature that you can find in all panels (clicking on the three dots in edit mode).
viewing code, you should have in your dashboard something like this:
<drilldown>
   <link target="_blank">/app/<your_app>/<new_dashboard>?ip=$row.ip$</link>
</drilldown>
and in the new dashboard put a token with the same name you used (in my samle "ip").
Ciao.
Giuseppe


