Are you a member of the Splunk Community?
- Find Answers
- :
- Using Splunk
- :
- Splunk Search
- :
- Timechart based on max count of 3 fields
- Subscribe to RSS Feed
- Mark Topic as New
- Mark Topic as Read
- Float this Topic for Current User
- Bookmark Topic
- Subscribe to Topic
- Mute Topic
- Printer Friendly Page
- Mark as New
- Bookmark Message
- Subscribe to Message
- Mute Message
- Subscribe to RSS Feed
- Permalink
- Report Inappropriate Content
I was given a base search to manipulate and create Timechart accordingly.
base search
| eval file_line = file.":".line
| eval errorList = message . ":" . file_line . ":" . level
| top 25 message,file_line,level by applicationBuild
| table applicationBuild level count file_line message
The result was formatted as such
| build2021 | ERROR | 8 | file1.java:111 | ErrorMessage123 |
| build2021 | ERROR | 4 | file2.java:123 | ErrorMessage456 |
| build2021 | ERROR | 3 | file3.java:456 | ErrorMessage789 |
I want to plot a Timechart from the above result. Output should be Top 25 Error message above against time.
I came out with
base search
| eval file_line = file.":".line
| eval errorList = message.";".file_line.";".level
| where errorList!="null"
| timechart useother=f usenull=f count max(message,file_line,level,applicationBuild) by errorList limit=25
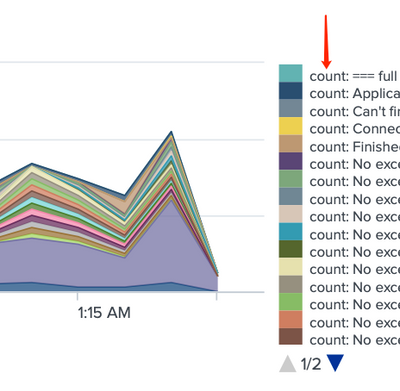
The legend of the result will append "count: " in front of the errorList that I cannot remove.
Any idea how can I remove this from the legend?
OR
are there better ways to achieve the same result?
- Mark as New
- Bookmark Message
- Subscribe to Message
- Mute Message
- Subscribe to RSS Feed
- Permalink
- Report Inappropriate Content
It is because you're calculating two separate statistics for each timepoints and in order to allow you to distinguish between them splunk calls them by the aggregation function you used.
You can add
| rename "count: *" as *
to remove the "count:" part from the column names.
- Mark as New
- Bookmark Message
- Subscribe to Message
- Mute Message
- Subscribe to RSS Feed
- Permalink
- Report Inappropriate Content
Thank you! this solve my problem

