Join the Conversation
- Find Answers
- :
- Using Splunk
- :
- Splunk Search
- :
- Re: Time from a search
- Subscribe to RSS Feed
- Mark Topic as New
- Mark Topic as Read
- Float this Topic for Current User
- Bookmark Topic
- Subscribe to Topic
- Mute Topic
- Printer Friendly Page
- Mark as New
- Bookmark Message
- Subscribe to Message
- Mute Message
- Subscribe to RSS Feed
- Permalink
- Report Inappropriate Content
Hi All,
I have a query like below.
index="abc" host=xxx
| eval Indicator=if(state=="RUNNING", "10", "0")
| timechart span=5min min(Indicator) as "Trend"
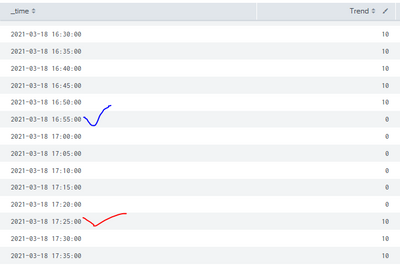
and it will give me results like below.
I am trying to get the time(_time) value when there is a change in the value of Trend happens.
eg myTime = 2021-03-18 16:55:00 (When trend changes from 10 to 0)
myTime = 2021-03-18 17:25:00 (When trend changes from 0 to 10)
Can someone please help me do it. Would really appreciate if someone can help with the difference between these times also.
myTime = 2021-03-18 16:55:00
myTime = 2021-03-18 17:25:00 Difference = 30 minutes
- Mark as New
- Bookmark Message
- Subscribe to Message
- Mute Message
- Subscribe to RSS Feed
- Permalink
- Report Inappropriate Content
hi @mariamathewtel,
You can use the delta command to identify the event where the Trend value is changed and also to calculate the duration. Try this,
index="abc" host=xxx
| eval Indicator=if(state=="RUNNING", "10", "0")
| timechart span=5min min(Indicator) as "Trend
| delta Trend as diff
| where diff!=0
| delta _time AS Duration
| eval Duration=tostring(abs(Duration), "duration")
If this reply helps you, an upvote/like would be appreciated.
- Mark as New
- Bookmark Message
- Subscribe to Message
- Mute Message
- Subscribe to RSS Feed
- Permalink
- Report Inappropriate Content
Hmm, so you basically want to switch the Status.
Could this be enough? Add it below your current SPL:
| eval status=if(status="DOWN", "UP", "DOWN")
Or you change the logic already when you assign either DOWN or UP.
After that you can filter to see only the DOWN ones with
| where status="DOWN"
Hope I got your requirement correct.
BR
Ralph
Karma and/or Solution tagging appreciated.
- Mark as New
- Bookmark Message
- Subscribe to Message
- Mute Message
- Subscribe to RSS Feed
- Permalink
- Report Inappropriate Content
Hi @manjunathmeti , @rnowitzki , need one more help
query works well and m getting the correct duration.
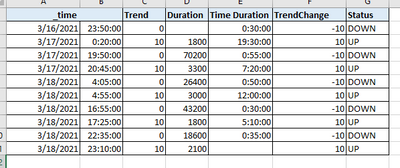
here as you can see the duration is getting updated to the row when the Trend is 10(UP). i want it to be attached to the row where trend is 0(DOWN) so that i can display the downtime properly.
Like below
So that it can be displayed like below in a dashboard. (Only Downtime)
- Mark as New
- Bookmark Message
- Subscribe to Message
- Mute Message
- Subscribe to RSS Feed
- Permalink
- Report Inappropriate Content
hi @mariamathewtel,
You can use autoregress to move Duration values to one row up. Try this:
index="abc" host=xxx
| eval Indicator=if(state=="RUNNING", "10", "0")
| timechart span=5min min(Indicator) as "Trend
| delta Trend as diff
| where diff!=0
| delta _time AS Duration
| eval Duration=tostring(abs(Duration), "duration")
| reverse
| autoregress Duration as Duration1
| reverse
| rename Duration1 as Duration
If this reply helps you, a like would be appreciated.
- Mark as New
- Bookmark Message
- Subscribe to Message
- Mute Message
- Subscribe to RSS Feed
- Permalink
- Report Inappropriate Content
- Mark as New
- Bookmark Message
- Subscribe to Message
- Mute Message
- Subscribe to RSS Feed
- Permalink
- Report Inappropriate Content
hi @mariamathewtel,
You can use the delta command to identify the event where the Trend value is changed and also to calculate the duration. Try this,
index="abc" host=xxx
| eval Indicator=if(state=="RUNNING", "10", "0")
| timechart span=5min min(Indicator) as "Trend
| delta Trend as diff
| where diff!=0
| delta _time AS Duration
| eval Duration=tostring(abs(Duration), "duration")
If this reply helps you, an upvote/like would be appreciated.
- Mark as New
- Bookmark Message
- Subscribe to Message
- Mute Message
- Subscribe to RSS Feed
- Permalink
- Report Inappropriate Content
- Mark as New
- Bookmark Message
- Subscribe to Message
- Mute Message
- Subscribe to RSS Feed
- Permalink
- Report Inappropriate Content
Hi @mariamathewtel ,
Try this SPL after your search that populates the table shown in the Screenshot:
| streamstats current=f window=1 last(Trend) as prev_trend
| eval trendchange=if(Trend!=prev_trend,"true", "false")
| where trendchange="true"
| streamstats current=f window=1 last(_time) as prev_time
| eval gap=tostring(_time-prev_time, "Duration")
| convert ctime(prev_time)
It will give you only the line where a change in Trend happened, including the gap since the last change took place.
Remove the line with "where" to see the whole list, I was not sure if you wanted to filter the ones without change or not.
Hope this helps.
BR
Ralph
Karma and/or Solution tagging appreciated.


