Turn on suggestions
Auto-suggest helps you quickly narrow down your search results by suggesting possible matches as you type.
Splunk Search
×
Join the Conversation
Without signing in, you're just watching from the sidelines. Sign in or Register to connect, share, and be part of the Splunk Community.
- Find Answers
- :
- Using Splunk
- :
- Splunk Search
- :
- Re: Table keep last event by criteria
Options
- Subscribe to RSS Feed
- Mark Topic as New
- Mark Topic as Read
- Float this Topic for Current User
- Bookmark Topic
- Subscribe to Topic
- Mute Topic
- Printer Friendly Page
- Mark as New
- Bookmark Message
- Subscribe to Message
- Mute Message
- Subscribe to RSS Feed
- Permalink
- Report Inappropriate Content
erwanlebaron
Engager
11-20-2019
09:34 AM
Hi
I've a question regarding stat or eventstat option last.
I would like to keep the last "event" in a table with several informations and I don't succeed.
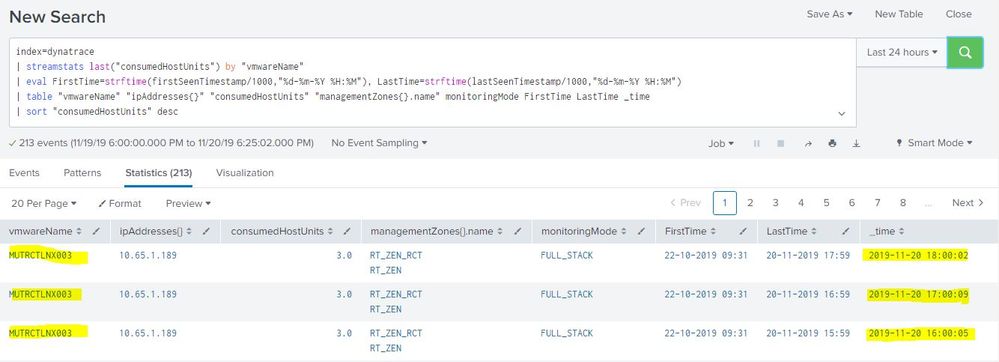
index=dynatrace
| streamstats last("consumedHostUnits") by "vmwareName"
| eval FirstTime=strftime(firstSeenTimestamp/1000,"%d-%m-%Y %H:%M"), LastTime=strftime(lastSeenTimestamp/1000,"%d-%m-%Y %H:%M")
| table "vmwareName" "ipAddresses{}" "consumedHostUnits" "managementZones{}.name" monitoringMode FirstTime LastTime _time
| sort "consumedHostUnits" desc
And I've 3 times a row for a server
And if I use "stats" instead of "eventstats" I lost data for the others column
index=dynatrace
| stats last("consumedHostUnits") as HU by "vmwareName"
| eval FirstTime=strftime(firstSeenTimestamp/1000,"%d-%m-%Y %H:%M"), LastTime=strftime(lastSeenTimestamp/1000,"%d-%m-%Y %H:%M")
| sort HU desc
| table "vmwareName" "ipAddresses{}" HU "managementZones{}.name" monitoringMode FirstTime LastTime _time
What is the solution to have the first screenshot with only a single line as the second screenshot ?
Regards
1 Solution
- Mark as New
- Bookmark Message
- Subscribe to Message
- Mute Message
- Subscribe to RSS Feed
- Permalink
- Report Inappropriate Content
mayurr98
Super Champion
11-20-2019
10:27 AM
try this:
index=dynatrace
| stats last("consumedHostUnits") as HU values(firstSeenTimestamp) as firstSeenTimestamp values(lastSeenTimestamp) as lastSeenTimestamp values("ipAddresses{}") as "ipAddresses{}" values("managementZones{}.name") as "managementZones{}.name" values(monitoringMode) as monitoringMode values(_time) as time by "vmwareName"
| eval FirstTime=strftime(firstSeenTimestamp/1000,"%d-%m-%Y %H:%M"), LastTime=strftime(lastSeenTimestamp/1000,"%d-%m-%Y %H:%M")
| convert ctime(time) as time
| sort HU desc
| table "vmwareName" "ipAddresses{}" HU "managementZones{}.name" monitoringMode FirstTime LastTime time
- Mark as New
- Bookmark Message
- Subscribe to Message
- Mute Message
- Subscribe to RSS Feed
- Permalink
- Report Inappropriate Content
erwanlebaron
Engager
11-21-2019
12:17 AM
I was exactly what I was looking for.
I hadn't understood the "values" while using stats.
Thanks a lot
- Mark as New
- Bookmark Message
- Subscribe to Message
- Mute Message
- Subscribe to RSS Feed
- Permalink
- Report Inappropriate Content
mayurr98
Super Champion
11-20-2019
10:27 AM
try this:
index=dynatrace
| stats last("consumedHostUnits") as HU values(firstSeenTimestamp) as firstSeenTimestamp values(lastSeenTimestamp) as lastSeenTimestamp values("ipAddresses{}") as "ipAddresses{}" values("managementZones{}.name") as "managementZones{}.name" values(monitoringMode) as monitoringMode values(_time) as time by "vmwareName"
| eval FirstTime=strftime(firstSeenTimestamp/1000,"%d-%m-%Y %H:%M"), LastTime=strftime(lastSeenTimestamp/1000,"%d-%m-%Y %H:%M")
| convert ctime(time) as time
| sort HU desc
| table "vmwareName" "ipAddresses{}" HU "managementZones{}.name" monitoringMode FirstTime LastTime time
Got questions? Get answers!
Join the Splunk Community Slack to learn, troubleshoot, and make connections with fellow Splunk practitioners in real time!
Meet up IRL or virtually!
Join Splunk User Groups to connect and learn in-person by region or remotely by topic or industry.
Get Updates on the Splunk Community!
Design, Compete, Win: Submit Your Best Splunk Dashboards for a .conf26 Pass
Hello Splunkers, We’re excited to kick off a Splunk Dashboard contest! We know that dashboards are a primary ...
May 2026 Splunk Expert Sessions: Security & Observability
Level Up Your Operations: May 2026 Splunk Expert Sessions
Whether you are refining your security posture or ...
Network to App: Observability Unlocked [May & June Series]
In today’s digital landscape, your environment is no longer confined to the data center. It spans complex ...


