Join the Conversation
- Find Answers
- :
- Using Splunk
- :
- Splunk Search
- :
- Re: Sysmon Event Parsing
- Subscribe to RSS Feed
- Mark Topic as New
- Mark Topic as Read
- Float this Topic for Current User
- Bookmark Topic
- Subscribe to Topic
- Mute Topic
- Printer Friendly Page
- Mark as New
- Bookmark Message
- Subscribe to Message
- Mute Message
- Subscribe to RSS Feed
- Permalink
- Report Inappropriate Content
Sysmon Event Parsing
I'm having trouble getting all the fields from sysmon automatically parse with the microsoft sysmon add in could someone tell me what i might be missing?
The events are coming into my home splunk instance (8.2.2) but not being fully parsed correctly, I'm pretty sure i need to use a transform, but the one I've tried isn't working (I'm pretty sure i did it wrong but *shrug* no idea if i did or not)
I've installed sysmon on my home computer and have the universal forwarder pointed to my home splunk instance.
I followed the guide i found here: https://hurricanelabs.com/splunk-tutorials/splunking-with-sysmon-series-part-1-the-setup/
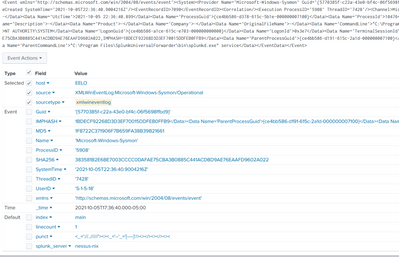
As you can see in the screenshot it only extracted some of the fields and the IMPHASH value carried over into some other data.
inputs.conf for sysmon
[WinEventLog://Microsoft-Windows-Sysmon/Operational]
disabled = false
renderXml = true
source = XMLWinEventLog:Microsoft-Windows-Sysmon/Operational
output of my transform with the path:
cat /opt/splunk/etc/apps/search/default/transforms.conf

[geo_us_states]
external_type = geo
filename = geo_us_states.kmz

[geo_countries]
external_type = geo
filename = geo_countries.kmz

[geo_attr_us_states]
filename = geo_attr_us_states.csv

[geo_attr_countries]
filename = geo_attr_countries.csv

[geo_hex]
external_type=geo_hex

[xmlwineventlog]
REGEX = "Data Name\=\'(?<_KEY_1>[A-Za-z]+)\'>(?<_VAL_1>[^<]+)<\/Data>"
DELIMS = "'>"
Here's a sample event straight from _raw (looked this event over nothing seemed overly sensitive)
<Event xmlns='http://schemas.microsoft.com/win/2004/08/events/event'><System><Provider Name='Microsoft-Windows-Sysmon' Guid='{5770385f-c22a-43e0-bf4c-06f5698ffbd9}'/><EventID>1</EventID><Version>5</Version><Level>4</Level><Task>1</Task><Opcode>0</Opcode><Keywords>0x8000000000000000</Keywords><TimeCreated SystemTime='2021-10-05T22:36:40.9004216Z'/><EventRecordID>7090</EventRecordID><Correlation/><Execution ProcessID='5908' ThreadID='7428'/><Channel>Microsoft-Windows-Sysmon/Operational</Channel><Computer>eelo</Computer><Security UserID='S-1-5-18'/></System><EventData><Data Name='RuleName'>-</Data><Data Name='UtcTime'>2021-10-05 22:36:40.899</Data><Data Name='ProcessGuid'>{ce4bb586-d378-615c-5b1e-000000007100}</Data><Data Name='ProcessId'>10476</Data><Data Name='Image'>C:\Program Files\SplunkUniversalForwarder\bin\splunk-powershell.exe</Data><Data Name='FileVersion'>-</Data><Data Name='Description'>-</Data><Data Name='Product'>-</Data><Data Name='Company'>-</Data><Data Name='OriginalFileName'>-</Data><Data Name='CommandLine'>"C:\Program Files\SplunkUniversalForwarder\bin\splunk-powershell.exe"</Data><Data Name='CurrentDirectory'>C:\WINDOWS\system32\</Data><Data Name='User'>NT AUTHORITY\SYSTEM</Data><Data Name='LogonGuid'>{ce4bb586-a1ce-615c-e703-000000000000}</Data><Data Name='LogonId'>0x3e7</Data><Data Name='TerminalSessionId'>0</Data><Data Name='IntegrityLevel'>System</Data><Data Name='Hashes'>MD5=1F8722C371906F7B659FA38B39B21661,SHA256=383581B2E6BE7003CCCC0DAFAE75CBA3B0885C441ACDBD9AE76EAAFD9602A022,IMPHASH=1BDECF92268D3D3EF70015DDFEB0FFB9</Data><Data Name='ParentProcessGuid'>{ce4bb586-d191-615c-2a1d-000000007100}</Data><Data Name='ParentProcessId'>18812</Data><Data Name='ParentImage'>C:\Program Files\SplunkUniversalForwarder\bin\splunkd.exe</Data><Data Name='ParentCommandLine'>"C:\Program Files\SplunkUniversalForwarder\bin\splunkd.exe" service</Data></EventData></Event>
- Mark as New
- Bookmark Message
- Subscribe to Message
- Mute Message
- Subscribe to RSS Feed
- Permalink
- Report Inappropriate Content
i think i fixed it on my own, i had some other sysmon apps installed and disabled all but Splunk_TA_microsoft_sysmon
AND installed
Splunk Add-on for Microsoft Windows (pretty sure this is what did it)

