Turn on suggestions
Auto-suggest helps you quickly narrow down your search results by suggesting possible matches as you type.
Splunk Search
×
Join the Conversation
Without signing in, you're just watching from the sidelines. Sign in or Register to connect, share, and be part of the Splunk Community.
Turn on suggestions
Auto-suggest helps you quickly narrow down your search results by suggesting possible matches as you type.
- Find Answers
- :
- Using Splunk
- :
- Splunk Search
- :
- Split trellis over two variables
Options
- Subscribe to RSS Feed
- Mark Topic as New
- Mark Topic as Read
- Float this Topic for Current User
- Bookmark Topic
- Subscribe to Topic
- Mute Topic
- Printer Friendly Page
- Mark as New
- Bookmark Message
- Subscribe to Message
- Mute Message
- Subscribe to RSS Feed
- Permalink
- Report Inappropriate Content
Split trellis over two variables
yifatcy
Path Finder
05-10-2021
03:21 AM
Hi,
Can I separate Trellis visualization by two variables as keys? In other words, I would like a timechart for each combination of the two variables.
(variable2_1 for example is an instance in variable2 column)
My goal is to have:
For now I succeeded either doing:
| stats max(variable1) by variable2, variable3
| stats max(variable1) by variable2, variable3
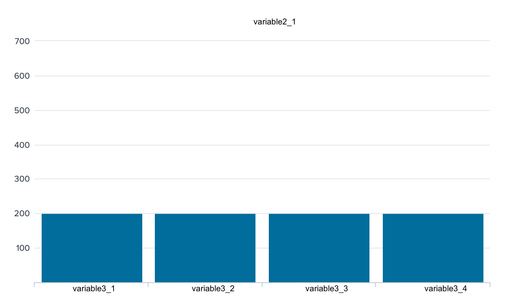
and the output (one of the Trellis for example):
But I wanted a timechart and a separate histogram for each combination of variable 2 and 3.
I also tried:
| timechart max(variable1) by variable2, variable3
which doesn't work.
Could you kindly assist? the aggregation section in Trellis also doesn't seem to produce the wanted results.
Thanks.
Get Updates on the Splunk Community!
Unlock Database Monitoring with Splunk Observability Cloud
In today’s fast-paced digital landscape, even minor database slowdowns can disrupt user experiences and ...
Purpose in Action: How Splunk Is Helping Power an Inclusive Future for All
At Cisco, purpose isn’t a tagline—it’s a commitment. Cisco’s FY25 Purpose Report outlines how the company is ...
[Upcoming Webinar] Demo Day: Transforming IT Operations with Splunk
Join us for a live Demo Day at the Cisco Store on January 21st 10:00am - 11:00am PST
In the fast-paced world ...


