Are you a member of the Splunk Community?
- Find Answers
- :
- Using Splunk
- :
- Splunk Search
- :
- Re: Scatter Plot for time x-axis and numbered Y ax...
- Subscribe to RSS Feed
- Mark Topic as New
- Mark Topic as Read
- Float this Topic for Current User
- Bookmark Topic
- Subscribe to Topic
- Mute Topic
- Printer Friendly Page
- Mark as New
- Bookmark Message
- Subscribe to Message
- Mute Message
- Subscribe to RSS Feed
- Permalink
- Report Inappropriate Content
Scatter Plot for time x-axis and numbered Y axis
I am looking to plot scatter plot to show all the data points in a particular time. Some how I am not able to get around it.
I tried using this:
..|eval time = _time | table time time_taken
This gives me the scatter plot with all the data points but the time displays in epoch.
Can i get a work around for this or a new method to get time in correct timestamp format.
Thanks.
- Mark as New
- Bookmark Message
- Subscribe to Message
- Mute Message
- Subscribe to RSS Feed
- Permalink
- Report Inappropriate Content
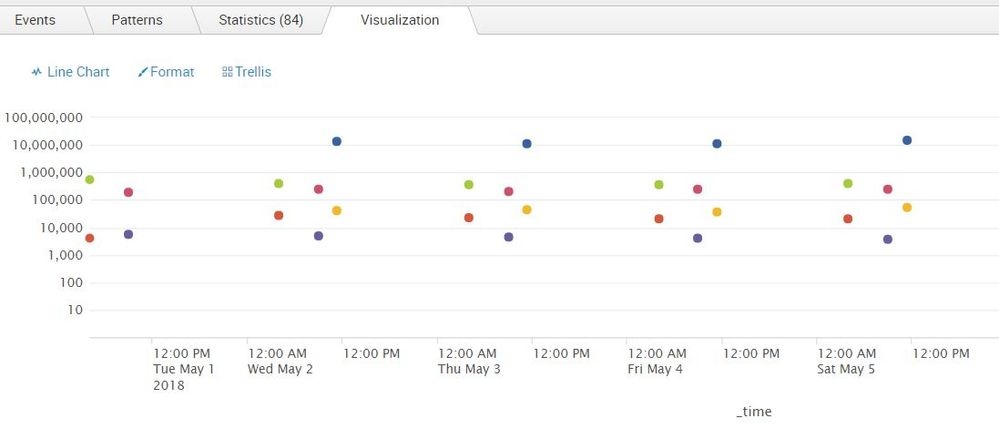
Scatter Chart is suitable for numerical expression on the X axis, not suitable for expressing rich time.
Therefore, I recommend using a Line Chart to try it.
1. Insert Null under each row of your table.
Example:
<base search>
| stats values(Y_Value) as Y_Value by _time,Status
| eval {Status}=Y_Value
| append
    [ search <base search>
    | stats values(Y_Value) as Y_Value by _time,Status
    | eval Y_Value =null
        ]
| sort 0 _time,Status
| fields - Y_Value ,Status
2. Set the graph as follows.
Graph: Line Chart
Setting: format> General> Null Values> select [Gaps]
- Mark as New
- Bookmark Message
- Subscribe to Message
- Mute Message
- Subscribe to RSS Feed
- Permalink
- Report Inappropriate Content
Thanks, it worked great. Note I had to use an Area Chart to plot dots rather than lines. (Splunk ver 7.3.3)
- Mark as New
- Bookmark Message
- Subscribe to Message
- Mute Message
- Subscribe to RSS Feed
- Permalink
- Report Inappropriate Content
Nice workaround, @murakoshi.
For what it's worth, there is now an Enhancement Request (SPL-152883) in place to make Scatterchart work with time. For some reason, they decided this behavior wasn't actually a bug but still needed fixing some day.
- Mark as New
- Bookmark Message
- Subscribe to Message
- Mute Message
- Subscribe to RSS Feed
- Permalink
- Report Inappropriate Content
Kudos @murakoshi
Nice technique. I was just trying to work out how to do this and came across this post. Thanks
- Mark as New
- Bookmark Message
- Subscribe to Message
- Mute Message
- Subscribe to RSS Feed
- Permalink
- Report Inappropriate Content
- Mark as New
- Bookmark Message
- Subscribe to Message
- Mute Message
- Subscribe to RSS Feed
- Permalink
- Report Inappropriate Content
I am looking at data at a span of months, even years.
- Mark as New
- Bookmark Message
- Subscribe to Message
- Mute Message
- Subscribe to RSS Feed
- Permalink
- Report Inappropriate Content
How granular or you wanting the data to show?
- Mark as New
- Bookmark Message
- Subscribe to Message
- Mute Message
- Subscribe to RSS Feed
- Permalink
- Report Inappropriate Content
The data is granular upto seconds.
- Mark as New
- Bookmark Message
- Subscribe to Message
- Mute Message
- Subscribe to RSS Feed
- Permalink
- Report Inappropriate Content
its basically the raw data i want to show. 'as is'
- Mark as New
- Bookmark Message
- Subscribe to Message
- Mute Message
- Subscribe to RSS Feed
- Permalink
- Report Inappropriate Content
Did you ever solve this with Splunk? I want to do something similar - plot a single pixel for each event, with X as Time...
- Mark as New
- Bookmark Message
- Subscribe to Message
- Mute Message
- Subscribe to RSS Feed
- Permalink
- Report Inappropriate Content
I have not really found a great way to handle this. Splunk's sort of backed everyone into a corner by treating _time specially for a few of these chart types, so about the best thing I know to do is ask your rep if you can lend your own voice to fixing Enhancement Request SPL-152883 to make Scatterchart work with time.
Of course they're redoing the ER system, so let's see if this bridges the gap from old to new system.
Otherwise, what doesn't work correctly with the workaround MattZerfas posted of just recreating your time field as a string and making it pretty?
- Mark as New
- Bookmark Message
- Subscribe to Message
- Mute Message
- Subscribe to RSS Feed
- Permalink
- Report Inappropriate Content
You are probably better off using a 3rd part viz to display that data then. Splunk native viz isn't the greatest at displaying large amounts of data points. Maybe look at importing a https://d3js.org/ chart?
- Mark as New
- Bookmark Message
- Subscribe to Message
- Mute Message
- Subscribe to RSS Feed
- Permalink
- Report Inappropriate Content
To make the display of the field be in something human readable, use fieldformat.
..
| eval time = _time
| fieldformat time = strftime(time, "%H:%M:%S")
| table time time_taken
Of course, that just does Hours:Minutes:Seconds. If you need full dates you can use "%y-%m-%d %H:%M%:%S". Or day plus time could be "%d %H:%M%:%S" or .... well, I think you get the idea.
Let us know how it goes!
Happy Splunking,
Rich
- Mark as New
- Bookmark Message
- Subscribe to Message
- Mute Message
- Subscribe to RSS Feed
- Permalink
- Report Inappropriate Content
This does not give me a scatter plot
- Mark as New
- Bookmark Message
- Subscribe to Message
- Mute Message
- Subscribe to RSS Feed
- Permalink
- Report Inappropriate Content
Could you elaborate on what it doesn't do? You wrote in the original post
..|eval time = _time | table time
time_taken This gives me the scatter
plot with all the data points but the
time displays in epoch.
Which implied you had a scatter plot, but just didn't have the format of the time sorted out.
What else is wrong?
- Mark as New
- Bookmark Message
- Subscribe to Message
- Mute Message
- Subscribe to RSS Feed
- Permalink
- Report Inappropriate Content
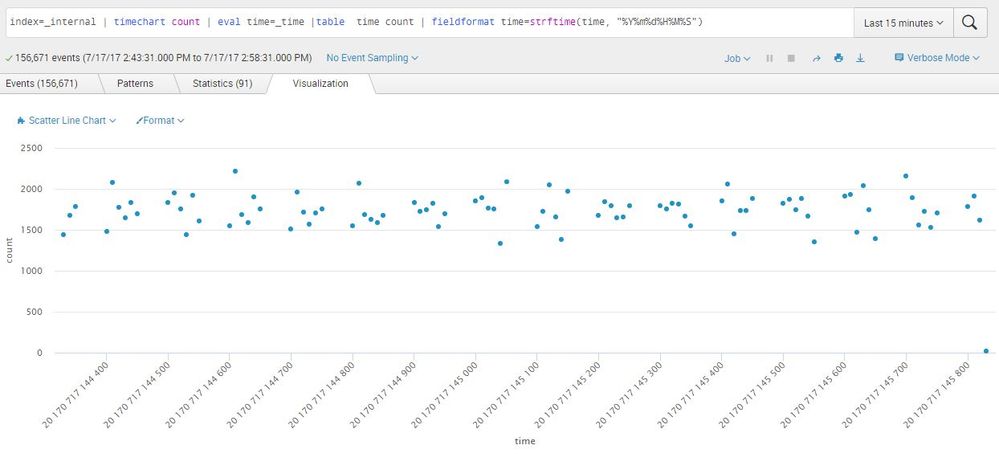
Yes I have the scatterplot with my code. But after using your code the scatter plot chart has all the values at 0. and the x axis is not time any more it is some number 20,30,40,50
- Mark as New
- Bookmark Message
- Subscribe to Message
- Mute Message
- Subscribe to RSS Feed
- Permalink
- Report Inappropriate Content
My code is nothing but the same code given in the question |eval time = _time | table time time_taken.. this when switched to scatter plot chart gives you all the individual data points. But the x axos changes to epoch
- Mark as New
- Bookmark Message
- Subscribe to Message
- Mute Message
- Subscribe to RSS Feed
- Permalink
- Report Inappropriate Content
You are right. Scatter charts don't seem to behave the same...
Usually you can fieldformat that stuff - it doesn't affect that the value is still in epoch, but it change the display of that field to be more human friendly.
In this case, the scatter chart doesn't work.
We're looking into it on Slack right now, digging around. Your question has been brought to the attention of others and we'll see if we can figure out if this is a bug or if there's a workaround.
- Mark as New
- Bookmark Message
- Subscribe to Message
- Mute Message
- Subscribe to RSS Feed
- Permalink
- Report Inappropriate Content
A ticket has been opened. I think I may have now convinced support there's a real problem here. I will post back what I find.
- Mark as New
- Bookmark Message
- Subscribe to Message
- Mute Message
- Subscribe to RSS Feed
- Permalink
- Report Inappropriate Content
Thanks rich! This is really appreciated!


